Data Explorations using R Studio

The purpose of this data exploration is to apply and the practice the skills gained from the Google Data Analytics Professional Certification. The data being explored relates to South African energy, primarily electricity. This exercise will be replicated on other tools later on such as Power BI and SQL.
The datasets are mostly in .csv format and were collected from the following sources:
Eskom
World Bank
Energy Data
Regulatory Indicator for Sustainable Energy (RISE)
South African Government
If the reader has any suggestions for better ways to perform the tasks or more interesting ways of presenting the findings please contact me via any of the channels found on this site’s Get in touch page or leave a comment in the Disqus section below if it’s available. For now I’m using some tutorials I find on YouTube.

[2022-09-21]
Following this tutorial by Business Science was the first thing after setting up the new project. Ran into some issues, outlined below, that come with not having done any explorations since certification. I’m recording all my steps - errors and all, even typos - as a way for me to also look back on this later on when I’m more familiar or need to be reminded that it wasn’t easy at the start..
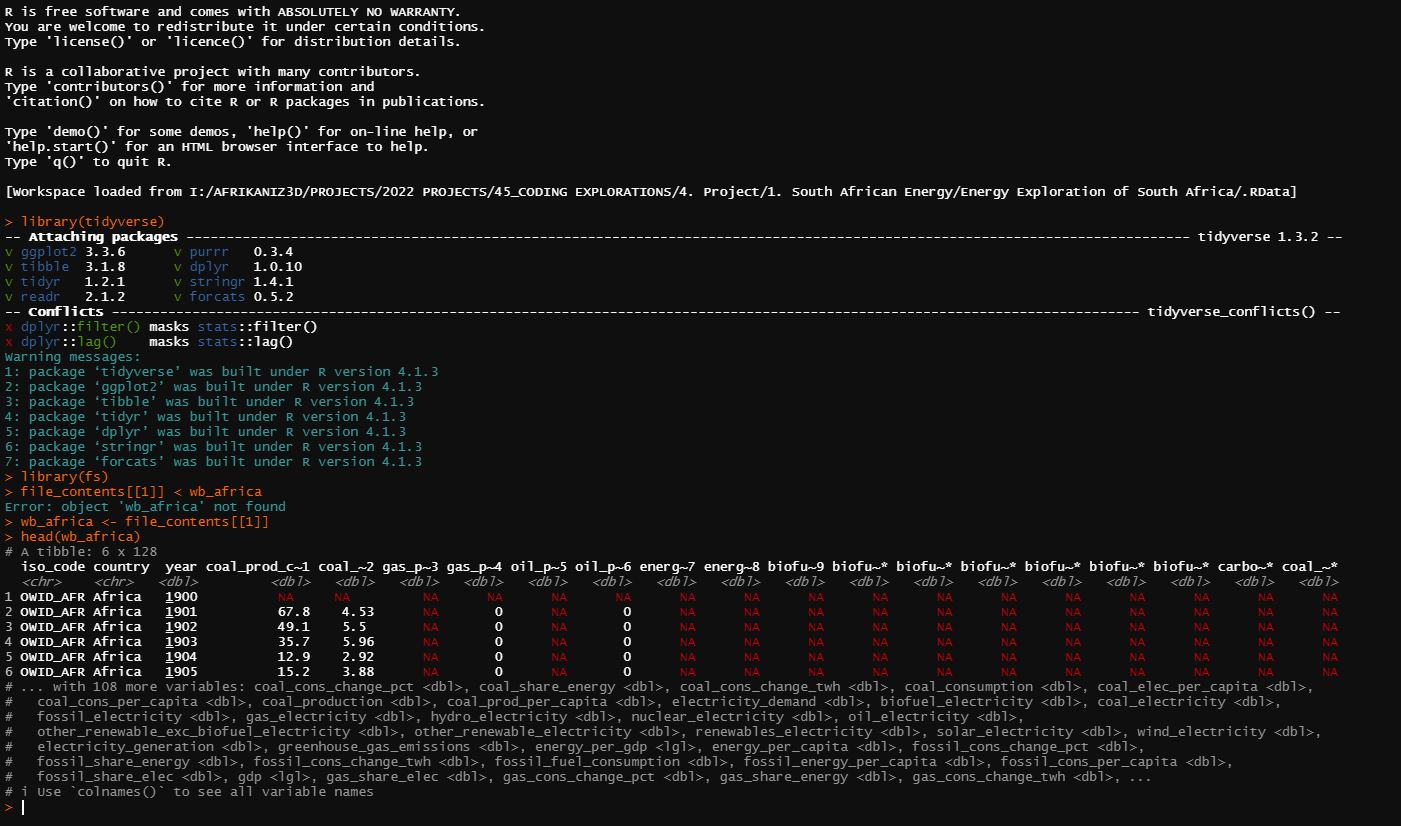
> library(tidyverse)
-- Attaching packages ---------------------------------------------------------------------------------------- tidyverse 1.3.1 --
v ggplot2 3.3.6 v purrr 0.3.4
v tibble 3.1.7 v dplyr 1.0.9
v tidyr 1.2.0 v stringr 1.4.0
v readr 2.1.2 v forcats 0.5.1
-- Conflicts ------------------------------------------------------------------------------------------- tidyverse_conflicts() --
x dplyr::filter() masks stats::filter()
x dplyr::lag() masks stats::lag()
Warning messages:
1: package ‘tidyverse’ was built under R version 4.1.3
2: package ‘ggplot2’ was built under R version 4.1.3
3: package ‘tibble’ was built under R version 4.1.3
4: package ‘dplyr’ was built under R version 4.1.3
> Library(fs)
Error in Library(fs) : could not find function "Library"
> library(fs)
> file.path(I:\AFRIKANIZ3D\PROJECTS\2022 PROJECTS\45_CODING EXPLORATIONS\4. Project\1. South African Energy\0. All Datasets)
Error: unexpected symbol in "file.path(I:\AFRIKANIZ3D"
> fs::dir_ls(I:\AFRIKANIZ3D\PROJECTS\2022 PROJECTS\45_CODING EXPLORATIONS\4. Project\1. South African Energy\0. All Datasets)
Error: unexpected symbol in "fs::dir_ls(I:\AFRIKANIZ3D"
> fs::as_fs_path("I:\AFRIKANIZ3D\PROJECTS\2022 PROJECTS\45_CODING EXPLORATIONS\4. Project\1. South African Energy\0. All Datasets")
Error: '\A' is an unrecognized escape in character string starting ""I:\A"
> fs::as_fs_path('I:\AFRIKANIZ3D\PROJECTS\2022 PROJECTS\45_CODING EXPLORATIONS\4. Project\1. South African Energy\0. All Datasets')
Error: '\A' is an unrecognized escape in character string starting "'I:\A"
> fs::as_fs_path(all_datasets)
Error in fs::as_fs_path(all_datasets) : object 'all_datasets' not found
> fs::as_fs_path("I:\AFRIKANIZ3D\PROJECTS\2022 PROJECTS\45_CODING EXPLORATIONS\4. Project\1. South African Energy\Energy Exploration of South Africa\all_datasets")
Error: '\A' is an unrecognized escape in character string starting ""I:\A"
> fs::as_fs_path("all_datasets")
all_datasets
> file_paths <- fs::as_fs_path("all-datasets")
> fs::as_fs_path("all-datasets")
all-datasets
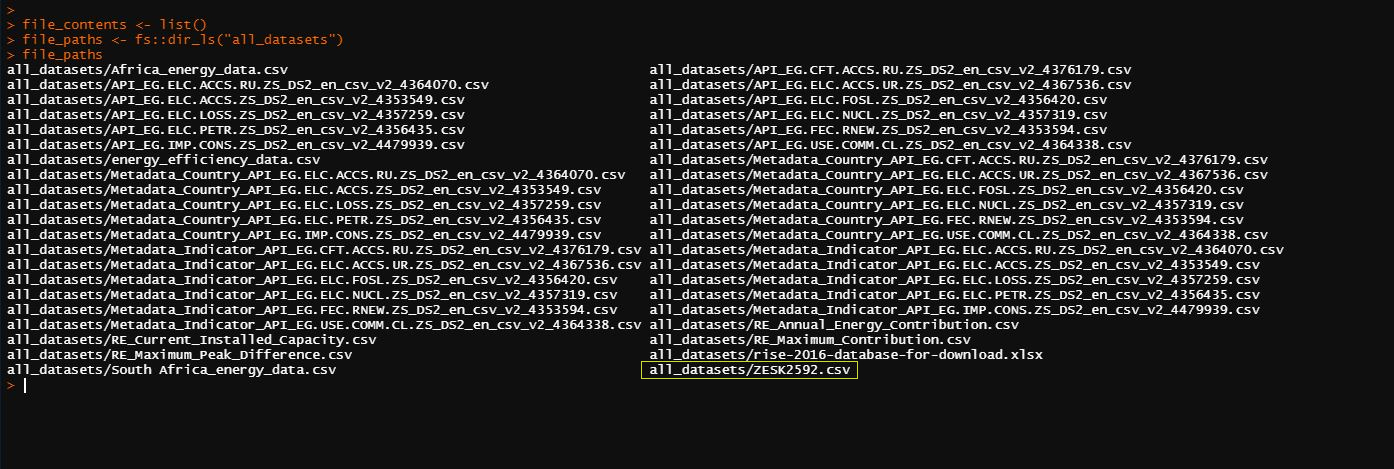
> file_paths <- fs::dir_ls("all_datasets")
> list(file_paths)
[[1]]
all_datasets/Africa_energy_data.csv
all_datasets/API_EG.CFT.ACCS.RU.ZS_DS2_en_csv_v2_4376179.csv
all_datasets/API_EG.ELC.ACCS.RU.ZS_DS2_en_csv_v2_4364070.csv
all_datasets/API_EG.ELC.ACCS.UR.ZS_DS2_en_csv_v2_4367536.csv
all_datasets/API_EG.ELC.ACCS.ZS_DS2_en_csv_v2_4353549.csv
all_datasets/API_EG.ELC.FOSL.ZS_DS2_en_csv_v2_4356420.csv
all_datasets/API_EG.ELC.LOSS.ZS_DS2_en_csv_v2_4357259.csv
all_datasets/API_EG.ELC.NUCL.ZS_DS2_en_csv_v2_4357319.csv
all_datasets/API_EG.ELC.PETR.ZS_DS2_en_csv_v2_4356435.csv
all_datasets/API_EG.FEC.RNEW.ZS_DS2_en_csv_v2_4353594.csv
all_datasets/API_EG.IMP.CONS.ZS_DS2_en_csv_v2_4479939.csv
all_datasets/API_EG.USE.COMM.CL.ZS_DS2_en_csv_v2_4364338.csv
all_datasets/energy_efficiency_data.csv
all_datasets/Metadata_Country_API_EG.CFT.ACCS.RU.ZS_DS2_en_csv_v2_4376179.csv
all_datasets/Metadata_Country_API_EG.ELC.ACCS.RU.ZS_DS2_en_csv_v2_4364070.csv
all_datasets/Metadata_Country_API_EG.ELC.ACCS.UR.ZS_DS2_en_csv_v2_4367536.csv
all_datasets/Metadata_Country_API_EG.ELC.ACCS.ZS_DS2_en_csv_v2_4353549.csv
all_datasets/Metadata_Country_API_EG.ELC.FOSL.ZS_DS2_en_csv_v2_4356420.csv
all_datasets/Metadata_Country_API_EG.ELC.LOSS.ZS_DS2_en_csv_v2_4357259.csv
all_datasets/Metadata_Country_API_EG.ELC.NUCL.ZS_DS2_en_csv_v2_4357319.csv
all_datasets/Metadata_Country_API_EG.ELC.PETR.ZS_DS2_en_csv_v2_4356435.csv
all_datasets/Metadata_Country_API_EG.FEC.RNEW.ZS_DS2_en_csv_v2_4353594.csv
all_datasets/Metadata_Country_API_EG.IMP.CONS.ZS_DS2_en_csv_v2_4479939.csv
all_datasets/Metadata_Country_API_EG.USE.COMM.CL.ZS_DS2_en_csv_v2_4364338.csv
all_datasets/Metadata_Indicator_API_EG.CFT.ACCS.RU.ZS_DS2_en_csv_v2_4376179.csv
all_datasets/Metadata_Indicator_API_EG.ELC.ACCS.RU.ZS_DS2_en_csv_v2_4364070.csv
all_datasets/Metadata_Indicator_API_EG.ELC.ACCS.UR.ZS_DS2_en_csv_v2_4367536.csv
all_datasets/Metadata_Indicator_API_EG.ELC.ACCS.ZS_DS2_en_csv_v2_4353549.csv
all_datasets/Metadata_Indicator_API_EG.ELC.FOSL.ZS_DS2_en_csv_v2_4356420.csv
all_datasets/Metadata_Indicator_API_EG.ELC.LOSS.ZS_DS2_en_csv_v2_4357259.csv
all_datasets/Metadata_Indicator_API_EG.ELC.NUCL.ZS_DS2_en_csv_v2_4357319.csv
all_datasets/Metadata_Indicator_API_EG.ELC.PETR.ZS_DS2_en_csv_v2_4356435.csv
all_datasets/Metadata_Indicator_API_EG.FEC.RNEW.ZS_DS2_en_csv_v2_4353594.csv
all_datasets/Metadata_Indicator_API_EG.IMP.CONS.ZS_DS2_en_csv_v2_4479939.csv
all_datasets/Metadata_Indicator_API_EG.USE.COMM.CL.ZS_DS2_en_csv_v2_4364338.csv
all_datasets/RE_Annual_Energy_Contribution.csv
all_datasets/RE_Current_Installed_Capacity.csv
all_datasets/RE_Maximum_Contribution.csv
all_datasets/RE_Maximum_Peak_Difference.csv
all_datasets/rise-2016-database-for-download.xlsx
all_datasets/South Africa_energy_data.csv
Packages are loaded and the datasets are now reading.It’s a lot of data to comb through. At this point my only plan is to peak into each one and see what info and variables are used to see what path they contribute the most to for visualizations.
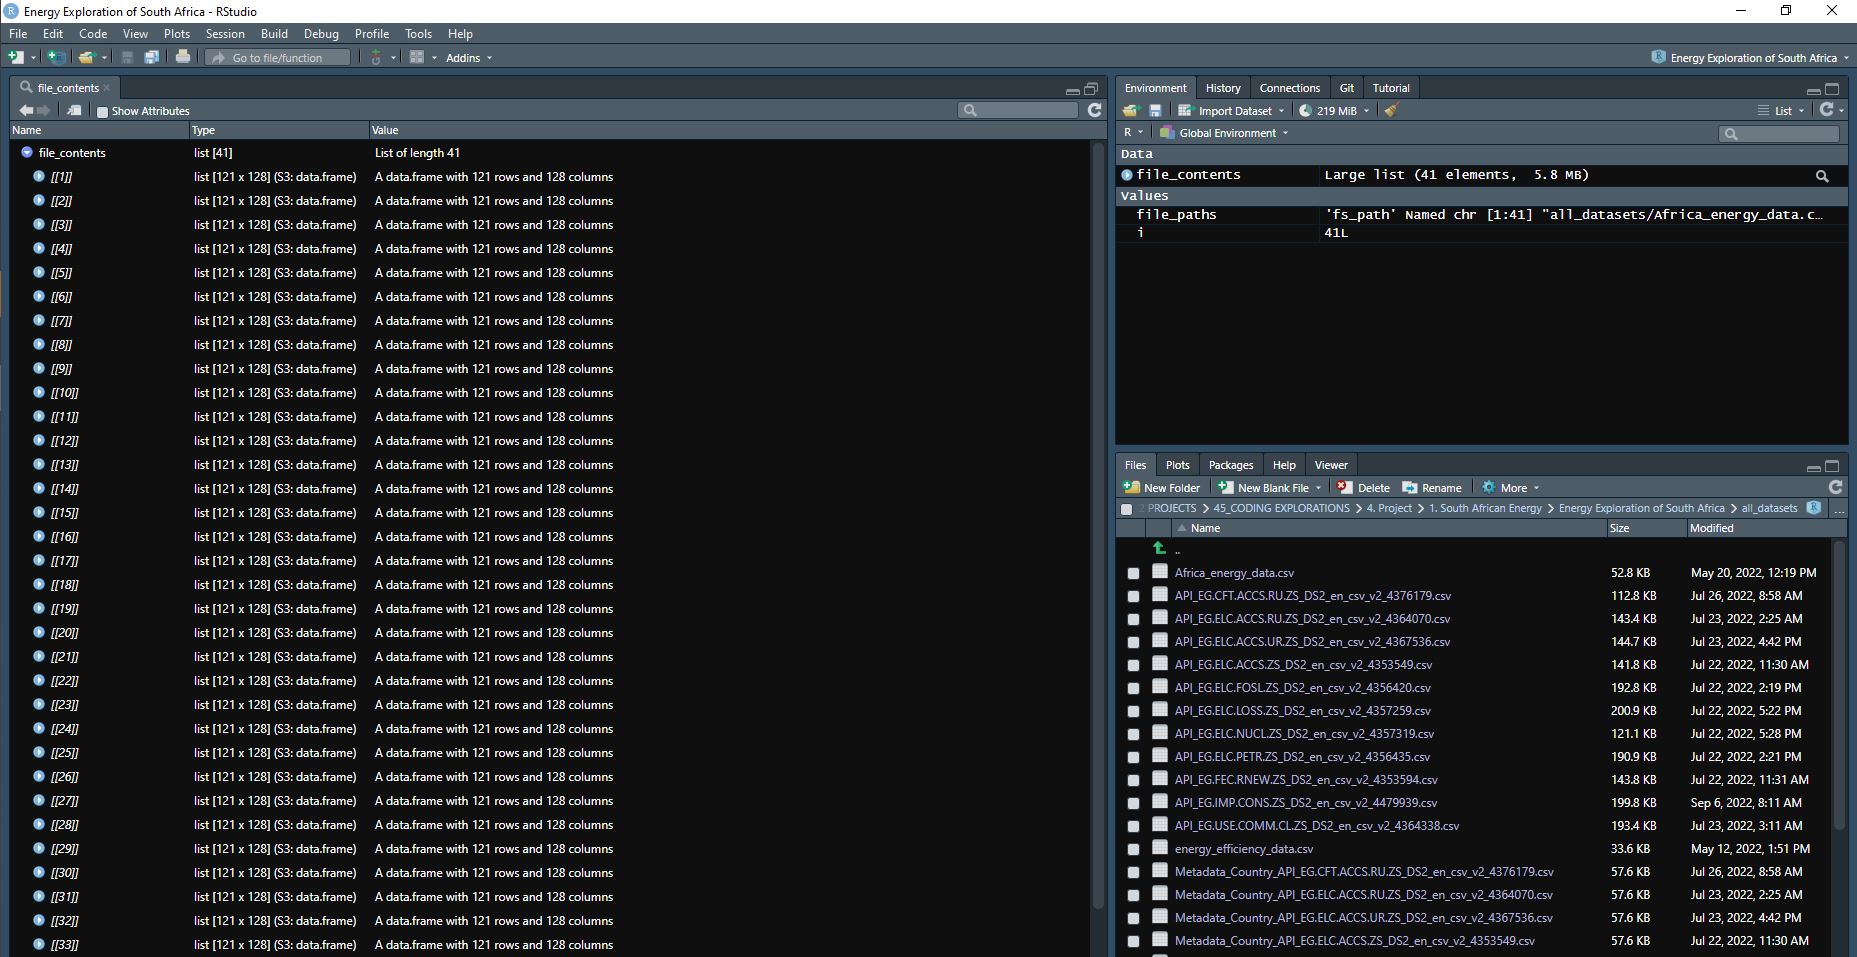
What I first thought was a strange coincidence - all the datasets having the same number columns and rows - soon shows that there has been an error somewhere..Will pick this back up tomorrow during a longer session.
[2022-09-22]
Better luck today. There was mistake in the step following the bringing in of the datasets. The tutorial shows two techniques for achieving the same result, but the second one (purrr map) had the benefit of being shorter - easier to remember - plus it then shows a preview of each dataset with some extra info.
The chunk in question being:
file_paths %>% map(function (path) {read_csv(path)})

A quick look at the first ten (10) lines of the datasets showed that some of them were too large and general, or discuss energies that aren’t present in South Africa. Going through each of the 41 datasets in their entirety, I filter them to select the ones that could best answer tell some kind of story about energy in South Africa
[2022-09-27]
(1) Africa_energy_data.csv There is a lot of data that spans a long timeline. The issue relates to the country tab listing all entries as “Africa”. The intention might have been to look at Africa as a continent, but I don’t understand why include the tab in the first place..? This will be useful in the case of comparing South Africa’s energy situation/performance to the rest of the continent.
The next few datasets (2 » 35) were downloaded from the World Bank and come in three (3) types.
(2) API_EG.CFT.ACCS.RU.ZS_DS2_en_csv_v2_4376179 » (12) API_EG.USE.COMM.CL.ZS_DS2_en_csv_v2_4364338
These are the main datasets that track measurements around the globe across multiple types of energy. This includes…
(14) Metadata_Country_API_EG.CFT.ACCS.RU.ZS_DS2_en_csv_v2_4376179 » (24) Metadata_Country_API_EG.USE.COMM.CL.ZS_DS2_en_csv_v2_4364338
The “Metadata Country” is a breakdown the of the globe and give special notes on each region/country that should be kept in mind when working with/comparing figures as some areas deal with factors that others don’t.
(25) - (35) Metadata_Indicator_API_EG.USE.COMM.CL.ZS_DS2_en_csv_v2_4364338
Finally, the “Metadata Indicator” datasets are mostly one line of code that explain the acronyms used in (2)»(12). These are know as the Indicator Codes, which is explained with a short note for context. This dataset also provides links to the organization(s) where the data was sourced. Some of the technologies covered in the World Bank datasets will not apply to South Africa, so this dataset will be most useful when renaming the datasets that will be kept for the remainder of the study to titles that are easier to work with.
[2022-10-03]
The next four (4) datasets were sourced from Eskom. The state entity has been going through it for ages now and, as this is not my wheelhouse, I’m choosing to look at the lesser-explored/discussed parts. The same points come up in the media over and over again, but I’m more interested in seeing their figures dealing with renewable energy. Future explorations may go further in depth.
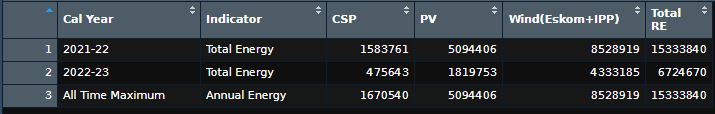
(36) RE_Annual_Energy_Contribution
Viewing the first of the four sets presented a small issue - missing units of measurement.
Not wanting to assume, I went back to the Eskom Data Portal and found that Mega Watts (MW) was the unit used.
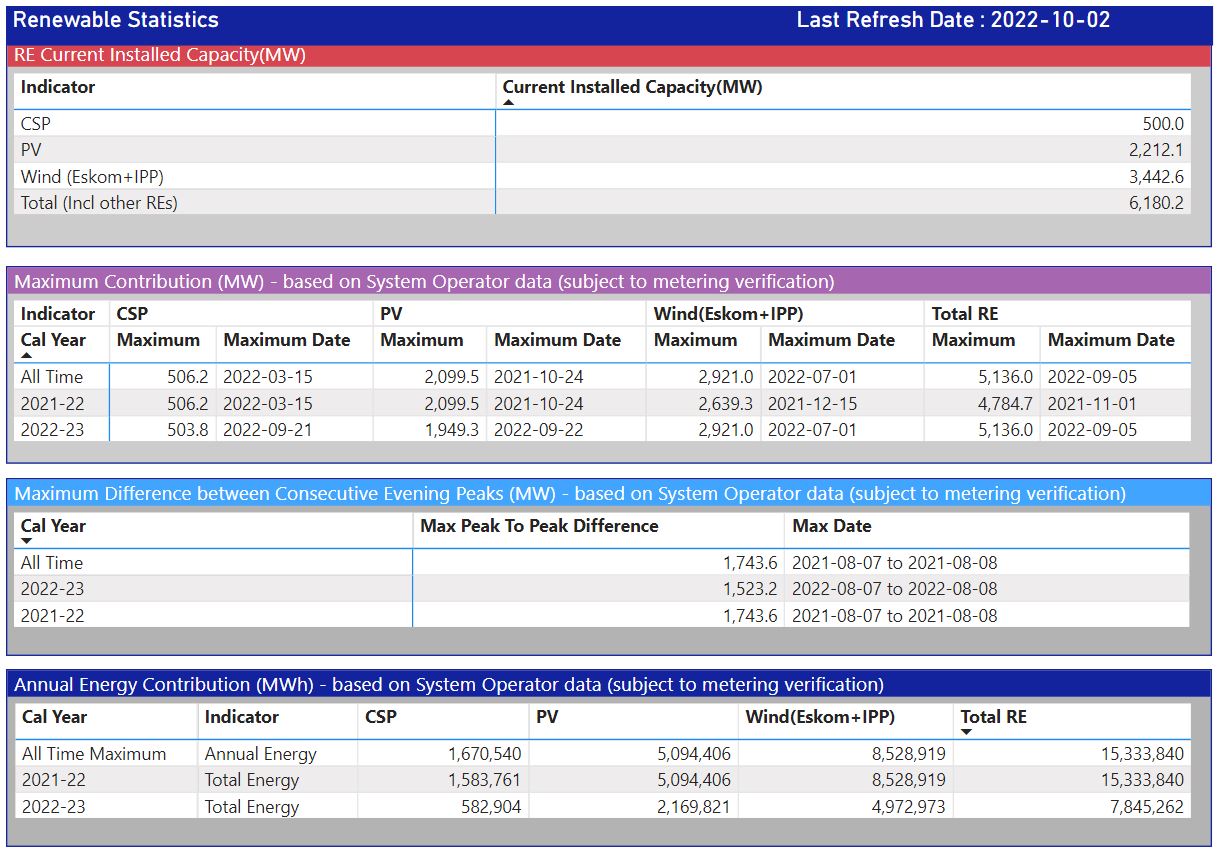
This dataset shows that Eskom currently deals with three (3) sources of renewable energy - Concentrated Solar Power (CSP), Photovoltaics (PV), and Wind (~blows~). Hydroelectric isn’t classified under this banner. The image above covers what is publicly available (2021-2023) and I have sent a request for any older datasets if they exist. This will have an impact on the overall study because some of the other datasets go all the way back to 1900, and renewable energy isn’t new to South Africa. It will still be useful to this exploration for the purposes of using real data.
(37) RE_Current_Installed_Capacity
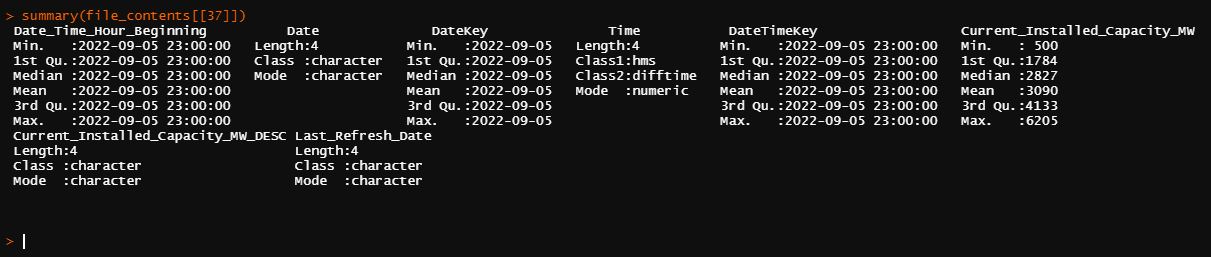
Another dataset that needed the aid of the online dashboard. I understand they were set up for that particular purpose. It would be helpful if an additional metadata dataset was introduced - similar to how the World Bank deliver information. This way more clarification/context can be provided. Adding units will also remove speculation f or those not in the field.
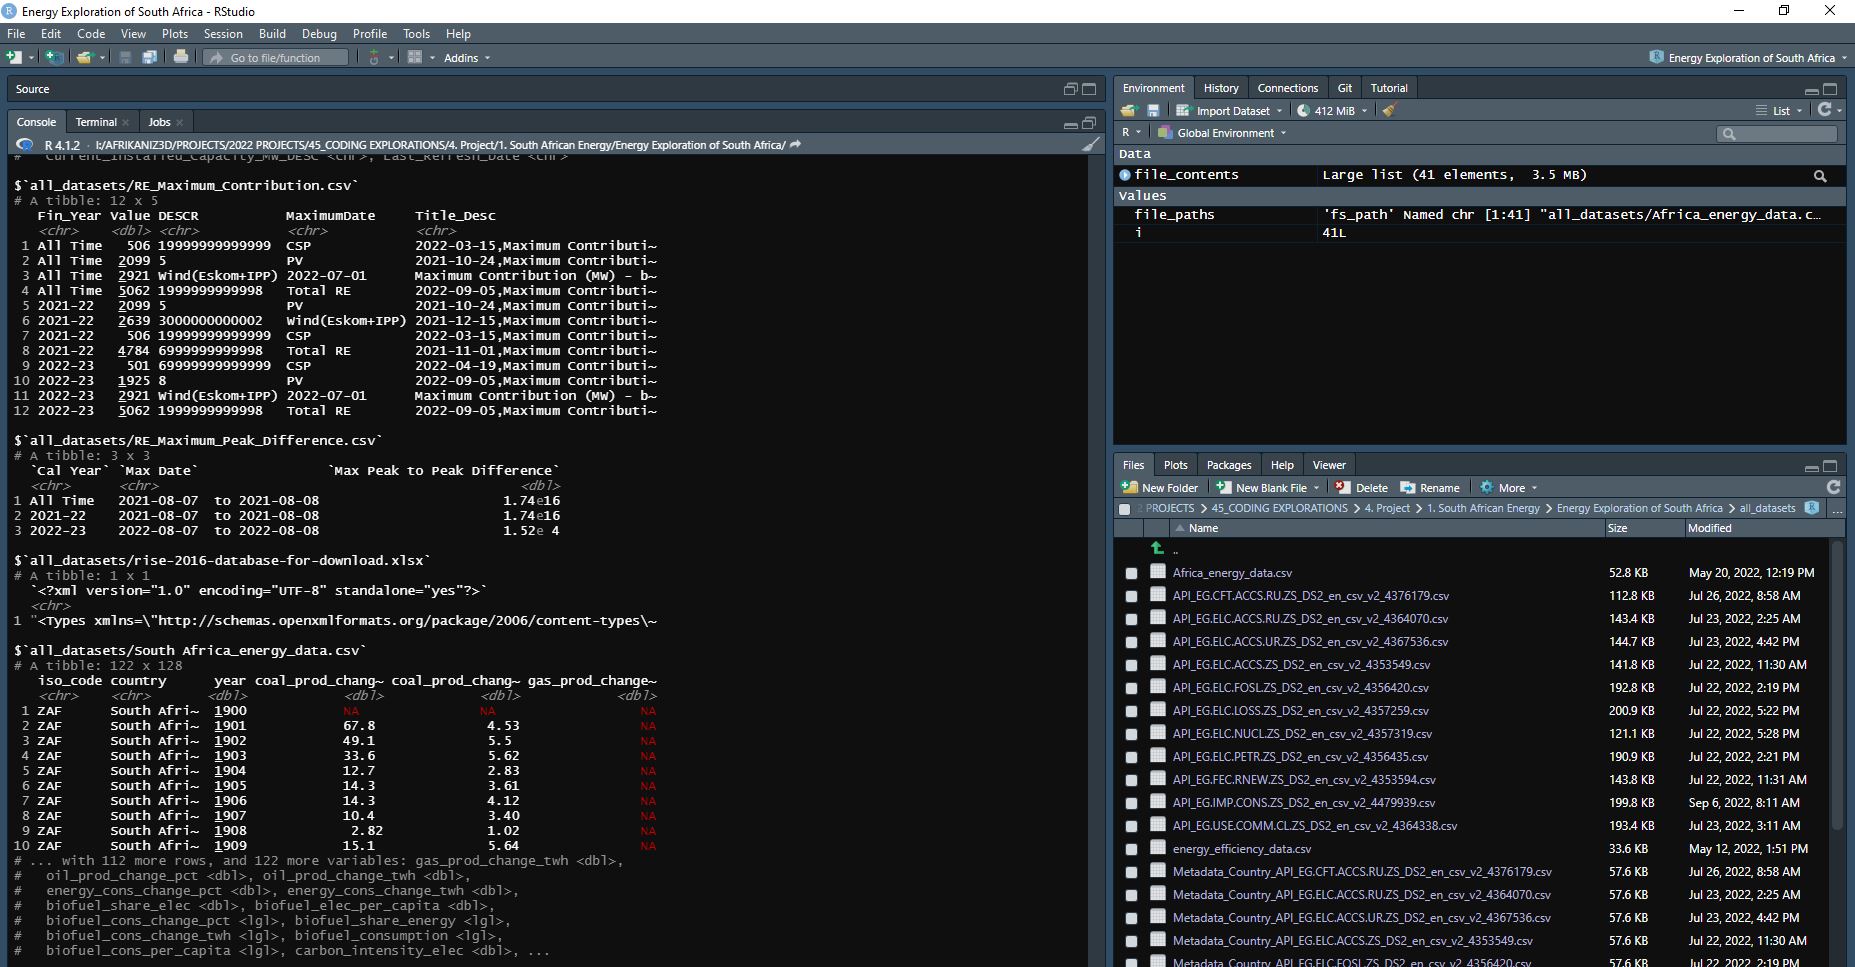
(38) RE_Maximum_Contribution
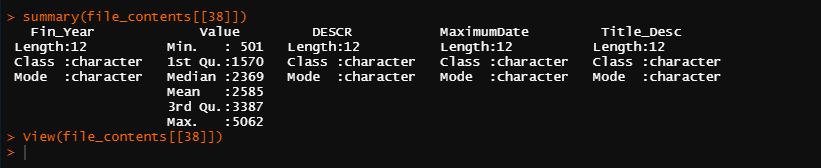
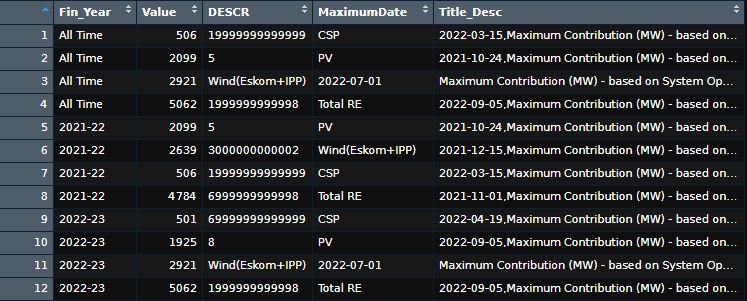
A similar story to the other two (2) sets. Overall it is showing that these sets will show a snapshot of where South Africa is today with regards to renewable energy. This may change if the request for more data proves successful.
(39) RE_Maximum_Peak_Difference
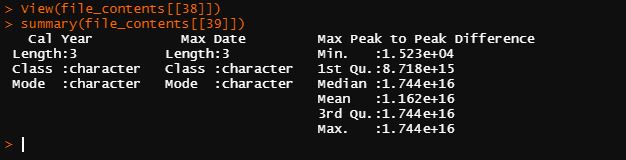
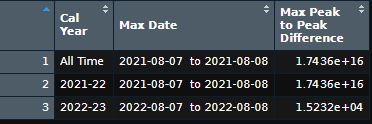
Same as above.
The time frame for the Eskom datasets (2021-2023) is very narrow, but it does give useful measurements that can be used in conjunction with datasets from other sources.
(40) rise-2016-database-for-download.xlsx
More of a rating system than measurements, this spreadsheet will be useful at the start of the final presentation to place South Africa in comparison to other countries around the world in different aspects such as access to energy, renewable energy, and mechanisms for carbon tracking.
(41) South Africa_energy_data.csv
> summary(file_contents[[41]])
iso_code country year coal_prod_change_pct coal_prod_change_twh gas_prod_change_pct gas_prod_change_twh oil_prod_change_pct
Length:122 Length:122 Min. :1900 Min. :-14.2670 Min. :-66.946 Min. :-47.241 Min. :-14.8590 Min. :-56.8940
Class :character Class :character 1st Qu.:1930 1st Qu.: 0.2677 1st Qu.: 1.025 1st Qu.:-11.002 1st Qu.: -1.3195 1st Qu.: -8.2570
Mode :character Mode :character Median :1960 Median : 3.4995 Median : 5.756 Median : -0.435 Median : 0.0000 Median : -0.1365
Mean :1960 Mean : 5.0620 Mean : 13.770 Mean : 1.116 Mean : 0.2926 Mean : 20.7065
3rd Qu.:1991 3rd Qu.: 7.1162 3rd Qu.: 17.165 3rd Qu.: 9.273 3rd Qu.: 1.0577 3rd Qu.: 0.0685
Max. :2021 Max. : 67.8100 Max. :121.327 Max. : 55.914 Max. : 13.6660 Max. :477.3650
NA's :2 NA's :2 NA's :94 NA's :86 NA's :94
oil_prod_change_twh energy_cons_change_pct energy_cons_change_twh biofuel_share_elec biofuel_elec_per_capita biofuel_cons_change_pct biofuel_share_energy
Min. :-12.67800 Min. :-5.8760 Min. :-85.0000 Min. :0.1520 Min. : 6.829 Mode:logical Mode:logical
1st Qu.: -0.31425 1st Qu.:-0.0145 1st Qu.: -0.0535 1st Qu.:0.1665 1st Qu.: 7.242 NA's:122 NA's:122
Median : 0.00000 Median : 2.1930 Median : 16.4710 Median :0.1740 Median : 7.724
Mean : 0.07536 Mean : 2.5605 Mean : 18.3167 Mean :0.1777 Mean : 7.875
3rd Qu.: 0.00000 3rd Qu.: 4.5075 3rd Qu.: 34.9835 3rd Qu.:0.1817 3rd Qu.: 8.352
Max. : 15.26300 Max. :16.4080 Max. :114.7630 Max. :0.2290 Max. :10.007
NA's :86 NA's :67 NA's :67 NA's :100 NA's :100
biofuel_cons_change_twh biofuel_consumption biofuel_cons_per_capita carbon_intensity_elec coal_share_elec coal_cons_change_pct coal_share_energy
Mode:logical Mode:logical Mode:logical Min. :707.0 Min. :84.38 Min. :-7.813 Min. :69.03
NA's:122 NA's:122 NA's:122 1st Qu.:746.2 1st Qu.:90.88 1st Qu.:-0.804 1st Qu.:72.78
Median :764.2 Median :92.73 Median : 1.856 Median :74.10
Mean :756.5 Mean :91.87 Mean : 2.355 Mean :74.63
3rd Qu.:769.8 3rd Qu.:93.29 3rd Qu.: 4.875 3rd Qu.:76.15
Max. :774.9 Max. :94.99 Max. :18.547 Max. :80.95
NA's :100 NA's :85 NA's :67 NA's :66
coal_cons_change_twh coal_consumption coal_elec_per_capita coal_cons_per_capita coal_production coal_prod_per_capita electricity_demand biofuel_electricity
Min. :-78.843 Min. : 283.1 Min. :3228 Min. :14236 Min. : 6.68 Min. : 1251 Min. :197.3 Min. :0.3600
1st Qu.: -4.181 1st Qu.: 455.8 1st Qu.:4040 1st Qu.:16566 1st Qu.: 83.05 1st Qu.: 9655 1st Qu.:224.0 1st Qu.:0.3925
Median : 12.907 Median : 791.3 Median :4163 Median :19365 Median : 257.31 Median :15219 Median :229.9 Median :0.4000
Mean : 12.374 Mean : 735.2 Mean :4119 Mean :18655 Mean : 595.37 Mean :18519 Mean :226.5 Mean :0.4068
3rd Qu.: 26.372 3rd Qu.: 968.8 3rd Qu.:4373 3rd Qu.:20277 3rd Qu.:1188.17 3rd Qu.:31406 3rd Qu.:233.9 3rd Qu.:0.4175
Max. :112.525 Max. :1091.2 Max. :4718 Max. :23074 Max. :1726.01 Max. :35502 Max. :243.7 Max. :0.4600
NA's :67 NA's :66 NA's :85 NA's :66 NA's :1 NA's :1 NA's :100 NA's :100
coal_electricity fossil_electricity gas_electricity hydro_electricity nuclear_electricity oil_electricity other_renewable_exc_biofuel_electricity
Min. :135.4 Min. :135.4 Min. :0.0000 Min. :0.021 Min. : 0.000 Min. :0.0000 Min. :0
1st Qu.:169.4 1st Qu.:169.4 1st Qu.:0.0000 1st Qu.:0.752 1st Qu.: 0.000 1st Qu.:0.0000 1st Qu.:0
Median :193.8 Median :197.6 Median :0.0000 Median :1.090 Median :10.070 Median :0.0300 Median :0
Mean :190.8 Mean :192.0 Mean :0.6327 Mean :1.335 Mean : 7.537 Mean :0.6529 Mean :0
3rd Qu.:212.6 3rd Qu.:215.2 3rd Qu.:1.6100 3rd Qu.:1.653 3rd Qu.:12.600 3rd Qu.:0.6700 3rd Qu.:0
Max. :231.7 Max. :232.9 Max. :3.7400 Max. :6.500 Max. :15.210 Max. :3.9900 Max. :0
NA's :85 NA's :85 NA's :85 NA's :65 NA's :65 NA's :85 NA's :100
other_renewable_electricity renewables_electricity solar_electricity wind_electricity electricity_generation greenhouse_gas_emissions energy_per_gdp
Min. :0.0000 Min. : 0.021 Min. :0.0000 Min. :0.0000 Min. :143.5 Min. :149.3 Min. :2.103
1st Qu.:0.0000 1st Qu.: 0.923 1st Qu.:0.0000 1st Qu.:0.0000 1st Qu.:181.7 1st Qu.:168.6 1st Qu.:2.874
Median :0.0000 Median : 1.620 Median :0.0000 Median :0.0000 Median :218.2 Median :175.3 Median :3.151
Mean :0.1681 Mean : 2.604 Mean :0.4144 Mean :0.6863 Mean :207.9 Mean :174.0 Mean :3.269
3rd Qu.:0.4000 3rd Qu.: 2.460 3rd Qu.:0.0200 3rd Qu.:0.0100 3rd Qu.:236.1 3rd Qu.:183.0 3rd Qu.:3.887
Max. :0.4600 Max. :19.150 Max. :4.5500 Max. :7.6900 Max. :246.8 Max. :191.1 Max. :4.478
NA's :65 NA's :65 NA's :65 NA's :65 NA's :85 NA's :100 NA's :68
energy_per_capita fossil_cons_change_pct fossil_share_energy fossil_cons_change_twh fossil_fuel_consumption fossil_energy_per_capita fossil_cons_per_capita
Min. :17921 Min. :-6.512 Min. :94.75 Min. :-89.8760 Min. : 354.1 Min. :17916 Min. :3303
1st Qu.:22340 1st Qu.: 0.060 1st Qu.:96.79 1st Qu.: 0.6595 1st Qu.: 597.8 1st Qu.:22056 1st Qu.:4040
Median :26338 Median : 2.054 Median :97.29 Median : 14.7550 Median :1003.7 Median :25536 Median :4164
Mean :25018 Mean : 2.460 Mean :97.79 Mean : 17.0199 Mean : 967.3 Mean :24434 Mean :4142
3rd Qu.:27169 3rd Qu.: 4.429 3rd Qu.:99.41 3rd Qu.: 34.3635 3rd Qu.:1297.9 3rd Qu.:26589 3rd Qu.:4373
Max. :29660 Max. :16.193 Max. :99.99 Max. :112.7280 Max. :1422.0 Max. :28580 Max. :4742
NA's :66 NA's :67 NA's :66 NA's :67 NA's :66 NA's :66 NA's :85
fossil_share_elec gdp gas_share_elec gas_cons_change_pct gas_share_energy gas_cons_change_twh gas_consumption gas_elec_per_capita
Min. :86.33 Min. :5.494e+10 Min. :0.0000 Min. :-30.815 Min. :0.0000 Min. :-6.6400 Min. : 0.000 Min. : 0.00
1st Qu.:91.68 1st Qu.:1.258e+11 1st Qu.:0.0000 1st Qu.: -4.199 1st Qu.:0.2263 1st Qu.:-0.0920 1st Qu.: 1.796 1st Qu.: 0.00
Median :92.98 Median :2.187e+11 Median :0.0000 Median : 1.232 Median :0.8995 Median : 0.0380 Median :10.885 Median : 0.00
Mean :92.42 Mean :2.692e+11 Mean :0.2692 Mean : 23.867 Mean :1.2229 Mean : 0.7366 Mean :15.797 Mean :11.36
3rd Qu.:93.69 3rd Qu.:3.563e+11 3rd Qu.:0.6840 3rd Qu.: 9.969 3rd Qu.:2.5177 3rd Qu.: 0.5385 3rd Qu.:35.053 3rd Qu.:28.64
Max. :94.99 Max. :6.733e+11 Max. :1.6150 Max. :879.467 Max. :3.1160 Max. :17.6970 Max. :44.108 Max. :67.53
NA's :85 NA's :53 NA's :85 NA's :73 NA's :66 NA's :67 NA's :66 NA's :85
gas_energy_per_capita gas_production gas_prod_per_capita hydro_share_elec hydro_cons_change_pct hydro_share_energy hydro_cons_change_twh hydro_consumption
Min. : 0.00 Min. : 0.00 Min. : 0.0 Min. :0.0840 Min. :-80.58 Min. :0.0140 Min. :-5.31600 Min. :0.058
1st Qu.: 56.85 1st Qu.: 0.00 1st Qu.: 0.0 1st Qu.:0.4120 1st Qu.:-33.16 1st Qu.:0.1740 1st Qu.:-1.17450 1st Qu.:1.946
Median :239.36 Median :12.80 Median :238.4 Median :0.5910 Median : -0.37 Median :0.2745 Median :-0.00300 Median :2.943
Mean :324.19 Mean :11.74 Mean :253.8 Mean :0.7951 Mean : 39.58 Mean :0.3387 Mean : 0.02055 Mean :3.282
3rd Qu.:664.64 3rd Qu.:19.47 3rd Qu.:441.5 3rd Qu.:1.0480 3rd Qu.: 60.12 3rd Qu.:0.5055 3rd Qu.: 1.38900 3rd Qu.:4.574
Max. :824.74 Max. :31.45 Max. :648.7 Max. :2.8300 Max. :644.64 Max. :0.9130 Max. : 4.96000 Max. :8.783
NA's :66 NA's :85 NA's :85 NA's :85 NA's :67 NA's :66 NA's :67 NA's :66
hydro_elec_per_capita hydro_energy_per_capita low_carbon_share_elec low_carbon_electricity low_carbon_elec_per_capita low_carbon_cons_change_pct
Min. : 0.977 Min. : 2.714 Min. : 4.139 Min. : 0.021 Min. : 0.977 Min. :-41.437
1st Qu.: 16.695 1st Qu.: 47.669 1st Qu.: 5.973 1st Qu.: 1.144 1st Qu.: 46.105 1st Qu.: -9.952
Median : 27.537 Median : 75.136 Median : 6.609 Median :11.830 Median :275.318 Median : 4.074
Mean : 33.265 Mean : 85.906 Mean : 7.168 Mean :10.141 Mean :218.500 Mean : 34.597
3rd Qu.: 46.105 3rd Qu.:124.879 3rd Qu.: 7.533 3rd Qu.:14.800 3rd Qu.:311.404 3rd Qu.: 14.143
Max. :108.258 Max. :250.231 Max. :13.673 Max. :31.410 Max. :523.134 Max. :653.782
NA's :65 NA's :66 NA's :85 NA's :65 NA's :65 NA's :67
low_carbon_share_energy low_carbon_cons_change_twh low_carbon_consumption low_carbon_energy_per_capita net_elec_imports_share_demand net_elec_imports
Min. :0.014 Min. :-12.2190 Min. : 0.058 Min. : 2.714 Min. :-3.085 Min. :-7.100
1st Qu.:0.595 1st Qu.: -0.3345 1st Qu.: 3.170 1st Qu.: 126.922 1st Qu.:-2.219 1st Qu.:-5.045
Median :2.697 Median : 0.5290 Median :31.881 Median : 737.017 Median :-1.607 Median :-3.640
Mean :2.194 Mean : 1.2835 Mean :26.542 Mean : 580.901 Mean :-1.516 Mean :-3.502
3rd Qu.:3.209 3rd Qu.: 3.5645 3rd Qu.:39.548 3rd Qu.: 862.620 3rd Qu.:-1.055 3rd Qu.:-2.518
Max. :5.192 Max. : 16.3080 Max. :70.696 Max. :1192.007 Max. : 0.672 Max. : 1.330
NA's :66 NA's :67 NA's :66 NA's :66 NA's :100 NA's :100
nuclear_share_elec nuclear_cons_change_pct nuclear_share_energy nuclear_cons_change_twh nuclear_consumption nuclear_elec_per_capita nuclear_energy_per_capita
Min. :3.704 Min. :-29.944 Min. :0.000 Min. :-7.361 Min. : 0.00 Min. : 0.0 Min. : 0.0
1st Qu.:5.147 1st Qu.: -5.737 1st Qu.:0.000 1st Qu.:-0.017 1st Qu.: 0.00 1st Qu.: 0.0 1st Qu.: 0.0
Median :5.454 Median : 4.899 Median :2.297 Median : 0.000 Median :26.87 Median :229.2 Median :617.2
Mean :5.529 Mean : 5.461 Mean :1.631 Mean : 0.698 Mean :20.08 Mean :162.9 Mean :438.5
3rd Qu.:6.054 3rd Qu.: 12.633 3rd Qu.:2.536 3rd Qu.: 2.536 3rd Qu.:33.61 3rd Qu.:259.8 3rd Qu.:677.2
Max. :6.794 Max. : 70.148 Max. :3.303 Max. :12.017 Max. :38.39 Max. :311.4 Max. :864.9
NA's :85 NA's :86 NA's :66 NA's :67 NA's :66 NA's :65 NA's :66
oil_share_elec oil_cons_change_pct oil_share_energy oil_cons_change_twh oil_consumption oil_elec_per_capita oil_energy_per_capita oil_production
Min. :0.0000 Min. :-13.4450 Min. :17.63 Min. :-43.858 Min. : 67.36 Min. : 0.000 Min. :3475 Min. : 0.000
1st Qu.:0.0000 1st Qu.: 0.5015 1st Qu.:20.48 1st Qu.: 1.046 1st Qu.:143.58 1st Qu.: 0.000 1st Qu.:5237 1st Qu.: 0.000
Median :0.0130 Median : 2.1510 Median :21.99 Median : 5.793 Median :212.57 Median : 0.526 Median :5543 Median : 4.872
Mean :0.2787 Mean : 2.7492 Mean :21.94 Mean : 3.909 Mean :216.29 Mean :11.861 Mean :5455 Mean : 7.457
3rd Qu.:0.2740 3rd Qu.: 6.0140 3rd Qu.:23.02 3rd Qu.: 8.512 3rd Qu.:295.09 3rd Qu.:12.884 3rd Qu.:5879 3rd Qu.:12.712
Max. :1.6940 Max. : 10.3380 Max. :26.91 Max. : 32.427 Max. :346.10 Max. :70.987 Max. :6316 Max. :36.501
NA's :85 NA's :67 NA's :66 NA's :67 NA's :66 NA's :85 NA's :66 NA's :85
oil_prod_per_capita other_renewables_elec_per_capita_exc_biofuel other_renewables_elec_per_capita other_renewables_cons_change_pct other_renewables_share_energy
Min. : 0.00 Min. :0 Min. : 0.000 Min. :-14.719 Min. :0.00000
1st Qu.: 0.00 1st Qu.:0 1st Qu.: 0.000 1st Qu.: -7.835 1st Qu.:0.00000
Median : 92.21 Median :0 Median : 0.000 Median : 0.792 Median :0.00000
Mean :159.79 Mean :0 Mean : 3.295 Mean : 13.054 Mean :0.03382
3rd Qu.:258.80 3rd Qu.:0 3rd Qu.: 7.334 3rd Qu.: 8.533 3rd Qu.:0.07525
Max. :771.84 Max. :0 Max. :10.007 Max. :143.333 Max. :0.11200
NA's :85 NA's :100 NA's :65 NA's :98 NA's :66
other_renewables_cons_change_twh other_renewable_consumption other_renewables_share_elec_exc_biofuel other_renewables_share_elec other_renewables_energy_per_capita
Min. :-0.15900 Min. :0.0000 Min. :0 Min. :0.000 Min. : 0.000
1st Qu.: 0.00000 1st Qu.:0.0000 1st Qu.:0 1st Qu.:0.000 1st Qu.: 0.000
Median : 0.00000 Median :0.0000 Median :0 Median :0.161 Median : 0.000
Mean : 0.01927 Mean :0.4551 Mean :0 Mean :0.114 Mean : 9.003
3rd Qu.: 0.00000 3rd Qu.:1.0720 3rd Qu.:0 3rd Qu.:0.175 3rd Qu.:20.264
Max. : 0.77900 Max. :1.3260 Max. :0 Max. :0.229 Max. :29.496
NA's :67 NA's :66 NA's :100 NA's :85 NA's :66
per_capita_electricity population primary_energy_consumption renewables_elec_per_capita renewables_share_elec renewables_cons_change_pct
Min. :3791 Min. : 5338536 Min. : 354.2 Min. : 0.977 Min. :0.084 Min. :-80.585
1st Qu.:4346 1st Qu.: 9234347 1st Qu.: 601.5 1st Qu.: 25.471 1st Qu.:0.604 1st Qu.:-15.848
Median :4479 Median :17312185 Median :1035.0 Median : 39.806 Median :1.018 Median : 3.625
Mean :4478 Mean :23760488 Mean : 994.0 Mean : 55.559 Mean :1.639 Mean : 42.931
3rd Qu.:4701 3rd Qu.:37489341 3rd Qu.:1361.0 3rd Qu.: 60.887 3rd Qu.:1.425 3rd Qu.: 57.998
Max. :5025 Max. :60041996 Max. :1479.4 Max. :318.943 Max. :8.336 Max. :644.643
NA's :85 NA's :66 NA's :65 NA's :85 NA's :67
renewables_share_energy renewables_cons_change_twh renewables_consumption renewables_energy_per_capita solar_share_elec solar_cons_change_pct solar_share_energy
Min. :0.0140 Min. :-5.2830 Min. : 0.058 Min. : 2.714 Min. :0.0000 Min. : 5.211 Min. :0.00000
1st Qu.:0.2552 1st Qu.:-0.6870 1st Qu.: 2.502 1st Qu.: 69.375 1st Qu.:0.0000 1st Qu.: 7.279 1st Qu.:0.00000
Median :0.4350 Median : 0.1780 Median : 4.293 Median :100.953 Median :0.0080 Median : 11.089 Median :0.00000
Mean :0.5634 Mean : 0.5857 Mean : 6.462 Mean :142.366 Mean :0.2747 Mean : 52.701 Mean :0.08321
3rd Qu.:0.6462 3rd Qu.: 1.9265 3rd Qu.: 6.014 3rd Qu.:179.286 3rd Qu.:0.0120 3rd Qu.: 20.973 3rd Qu.:0.00400
Max. :2.3730 Max. : 8.8780 Max. :32.310 Max. :550.387 Max. :1.9810 Max. :359.373 Max. :0.93800
NA's :66 NA's :67 NA's :66 NA's :66 NA's :85 NA's :102 NA's :66
solar_cons_change_twh solar_consumption solar_elec_per_capita solar_energy_per_capita wind_share_elec wind_cons_change_pct wind_share_energy wind_cons_change_twh
Min. :0.0000 Min. : 0.00000 Min. : 0.000 Min. : 0.00 Min. :0.0000 Min. : -0.633 Min. :0.0000 Min. :-0.0010
1st Qu.:0.0000 1st Qu.: 0.00000 1st Qu.: 0.000 1st Qu.: 0.00 1st Qu.:0.0000 1st Qu.: -0.602 1st Qu.:0.0000 1st Qu.: 0.0000
Median :0.0000 Median : 0.00000 Median : 0.000 Median : 0.00 Median :0.0040 Median : 8.724 Median :0.0000 Median : 0.0000
Mean :0.2323 Mean : 1.18723 Mean : 7.170 Mean : 20.71 Mean :0.4549 Mean : 192.600 Mean :0.1077 Mean : 0.3136
3rd Qu.:0.0040 3rd Qu.: 0.05075 3rd Qu.: 0.412 3rd Qu.: 1.04 3rd Qu.:0.0160 3rd Qu.: 41.975 3rd Qu.:0.0020 3rd Qu.: 0.0000
Max. :4.0960 Max. :12.77400 Max. :75.780 Max. :215.37 Max. :3.3480 Max. :2763.830 Max. :1.2670 Max. : 5.0560
NA's :67 NA's :66 NA's :65 NA's :66 NA's :85 NA's :105 NA's :66 NA's :67
wind_consumption wind_elec_per_capita wind_energy_per_capita
Min. : 0.000 Min. : 0.000 Min. : 0.0000
1st Qu.: 0.000 1st Qu.: 0.000 1st Qu.: 0.0000
Median : 0.000 Median : 0.000 Median : 0.0000
Mean : 1.538 Mean : 11.829 Mean : 26.7436
3rd Qu.: 0.032 3rd Qu.: 0.211 3rd Qu.: 0.6773
Max. :17.246 Max. :128.077 Max. :290.7840
NA's :66 NA's :65 NA's :66
Going back all the way to 1900, the information found in this dataset is enough to start telling South Africa’s energy story. It covers all the major types from energy - from before they were implemented, and it overlaps with period explored in other datasets. It’s measurements are not as general as the ones found in other sets, so this allows for a more specific direction to be taken for the final report.
[2022-10-11]
Eskom came through (2022-10-05) and emailed a file that dates back to 2018 - a little more to work with.
Before examining the dataset, I cleared all the existing object in the workspace in order to re-import them along with the new .csv file bring the total batch from 41 files to 42. I also renamed the file to “ZESK2592.csv” (from “ESK2592.csv”) so that it should occupy the final spot on the list - and not offset the work done previously (above).
(42) ZESK2592.csv
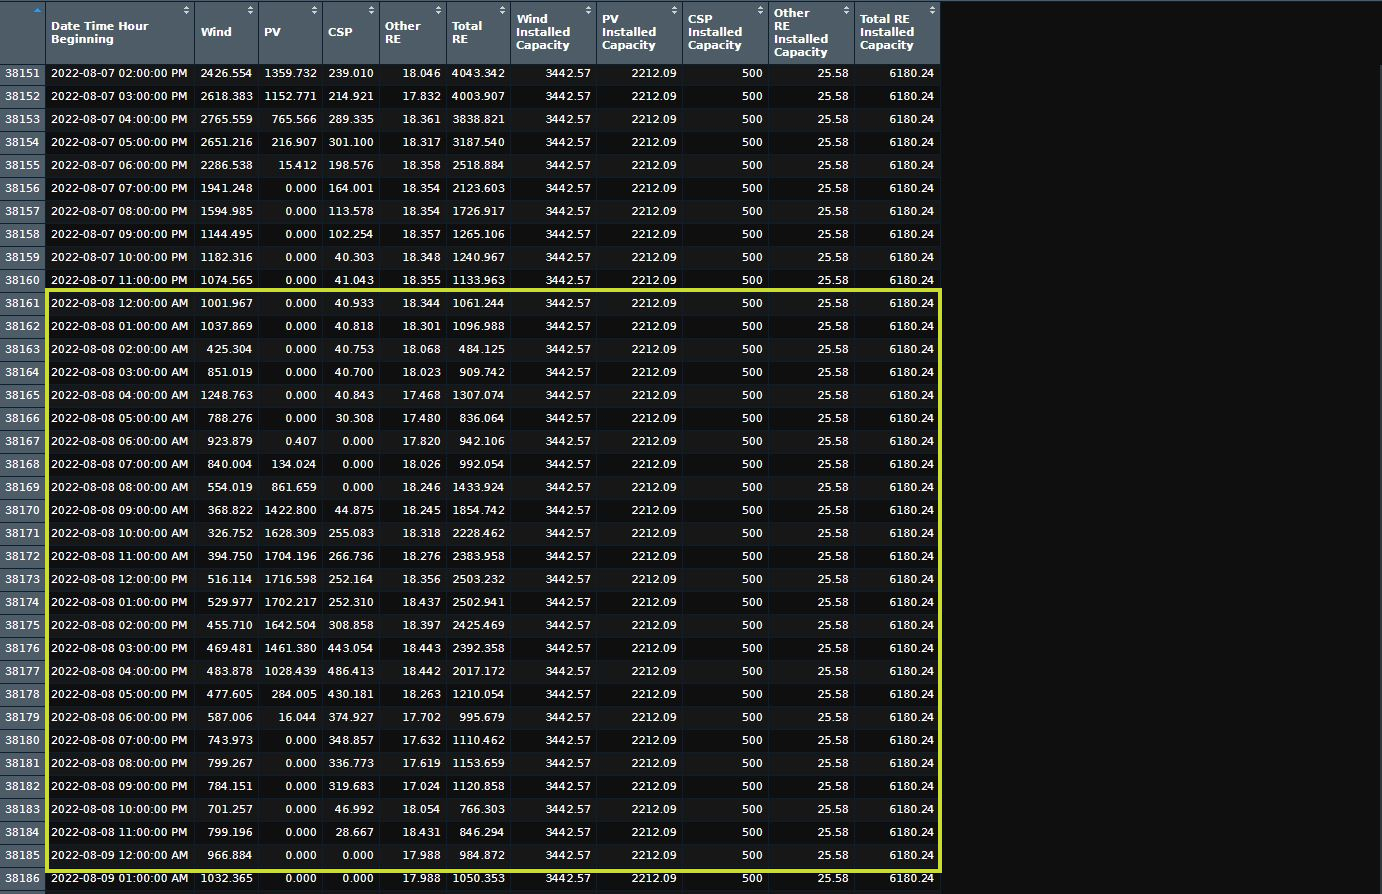
The metadata of this dataset described a large number for the rows. A view of it showed that the reason was due to hourly readings for each type of energy recorded. This presents a great opportunity to explore the individual performances of each type of energy and make comparisons relative to their unique conditions.
As it stands the current plan moving forward, using the information covered above, is:
-
Brief introduction/discussion of energy sources
-
Map out the global energy figures
-
Explore South Africa’s energy history
-
Visualizing the findings using different methods within RStudio I’ve been wanting to try out

[2022-10-21]
During the filtering step I thought there would be some datasets I could exclude from the exploration, but all of them contribute a useful bit of information. In this step I will simplify the workflow by renaming the datasets to titles that make it easier to identify the contents/purpose for the dataset in this exercise.
The naming convention is “name/acronym of source”_“subject”
Acronyms used:
wb = World Bank
ed = Energy Data
rise = Regulatory Indicator for Sustainable Energy
eskom = Eskom
za = South African Government
Following the steps pictured above, this is what the datasets are now labelled (same order):
wb__south_africa
wb_cook_fuel_rural
wb_elec_access_rural
wb_elec_access_urban
wb_elec_access
wb_elec_prod_fossils
wb_elec_output_loss
wb_elec_prod_nuclear
wb_elec_prod_oil
wb_renewables_consumption
wb_net_energy_imports
wb_nuclear_n_alternatives
ed_efficiency
meta_wb_cook_fuel_rural
meta_wb_elec_access_rural
meta_wb_elec_access_urban
meta_wb_elec_access
meta_wb_elec_prod_fossils
meta_wb_elec_output_loss
meta_wb_elec_prod_nuclear
meta_wb_elec_prod_oil
meta_wb_renewables_consumption
meta_wb_net_energy_imports
meta_wb_nuclear_n_alternatives
meta_indi_wb_cook_fuel_rural
meta_indi_wb_elec_access_rural
meta_indi_wb_elec_access_urban
meta_indi_wb_elec_access
meta_indi_wb_elec_prod_fossils
meta_indi_wb_elec_output_loss
meta_indi_wb_elec_prod_nuclear
meta_indi_wb_elec_prod_oil
meta_indi_wb_renewables_consumption
meta_indi_wb_net_energy_imports
meta_indi_wb_nuclear_n_alternatives
eskom_re_annual_contribution
eskom_re_current_installed_capacity
eskom_re_maximum_contribution
eskom_re_max_peak_difference
wb_south_africa
eskom_re_hourly
Wasn’t sure this could be automated, the the first round when importing the datasets, but after some manual back and forth the datasets are now renamed and ready to visualize and compare alongside some other information. I also excluded the meta datasets from the source naming convention to make it easier to remember that are not the primary dataset.
The next set of tasks look at visualizing and comparing what’s been recorded and seeing how we fare (according to what’s been shown).
[2022-12-16]
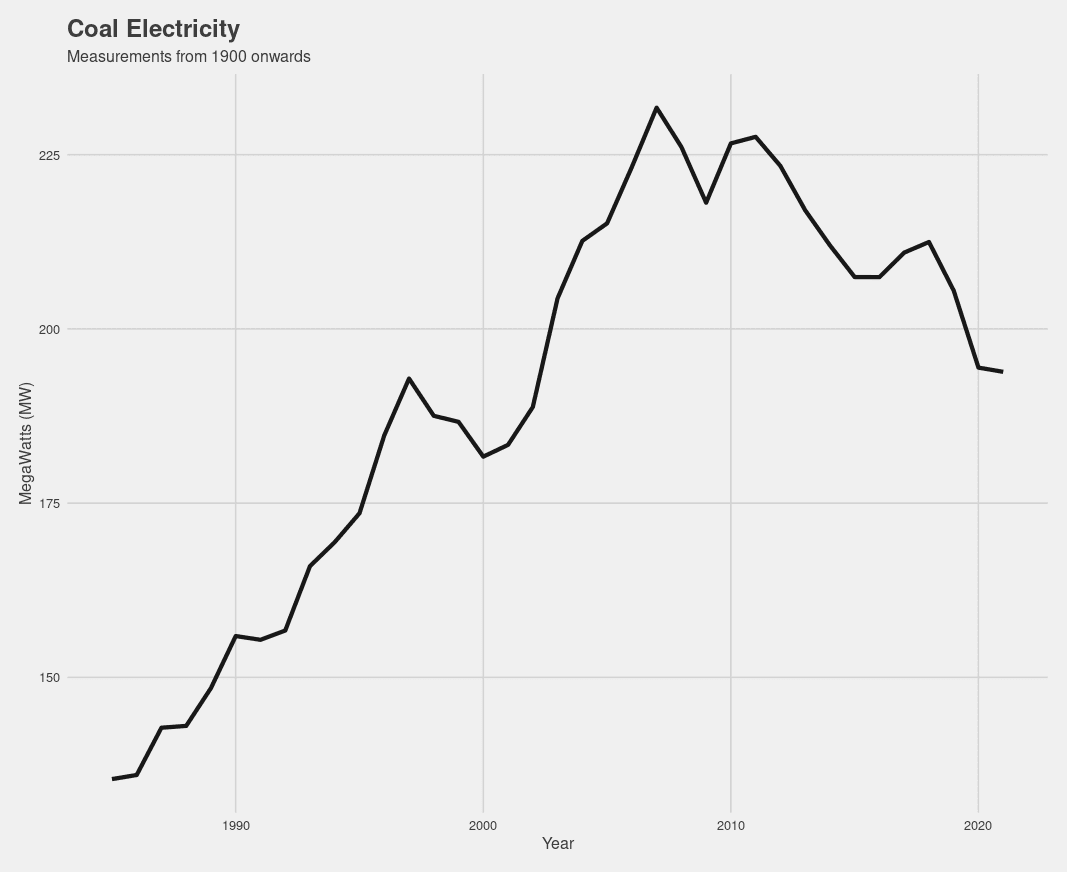
I chose to first go with generating some charts from the chosen dataset wb_south_africa. Below are the lines used followed by the result.
CoalGraph = wb_south_africa

CoalGraph%>%
  filter(!is.na(coal_electricity)) %>%
  ggplot(aes(x = year, y = coal_electricity)) +
  geom_line(size = 1.5, alpha = 0.9) +
  labs(title = "Coal Electricity", subtitle = "Measurements from 1900 onwards", x = "Year", y = "MegaWatts (MW)" ) +
  theme_fivethirtyeight() +
  theme(axis.title = element_text())
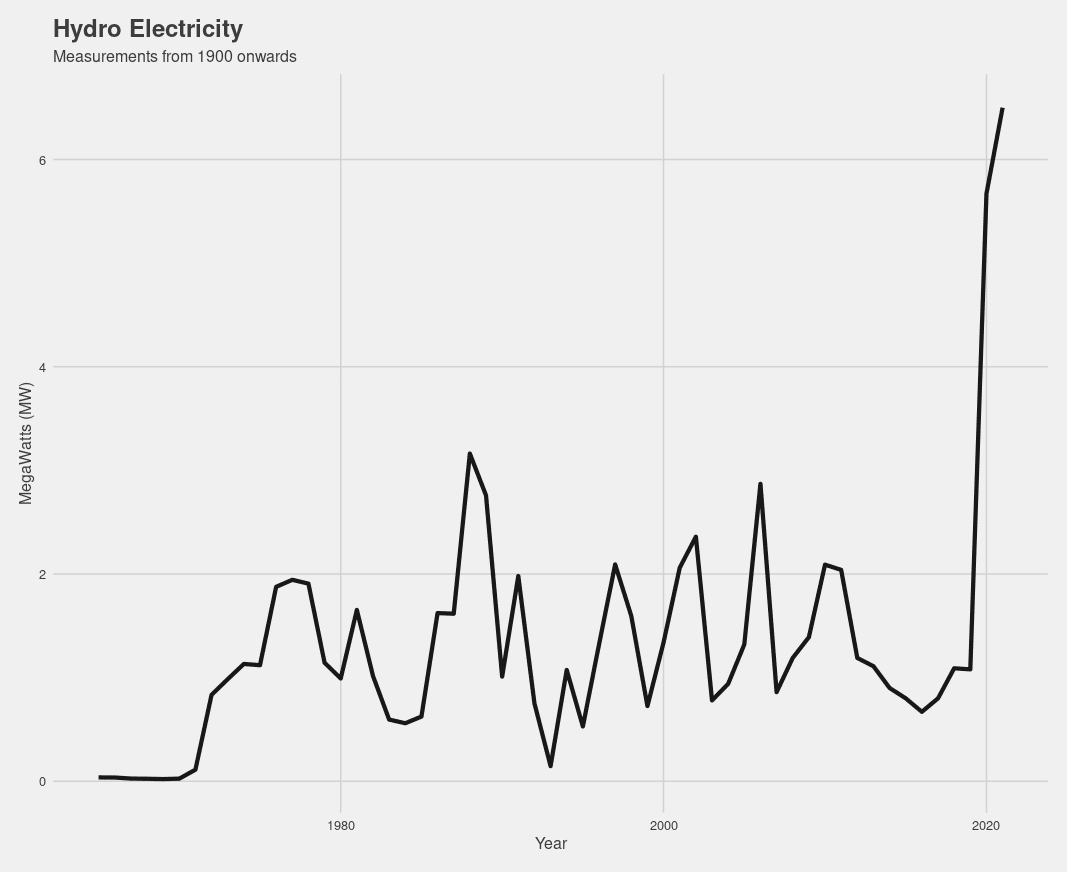
HydroGraph = wb_south_africa

HydroGraph%>%
  filter(!is.na(hydro_electricity)) %>%
  ggplot(aes(x = year, y = hydro_electricity)) +
  geom_line(size = 1.5, alpha = 0.9) +
  labs(title = "Hydro Electricity", subtitle = "Measurements from 1900 onwards", x = "Year", y = "MegaWatts (MW)" ) +
  theme_fivethirtyeight() +
  theme(axis.title = element_text())
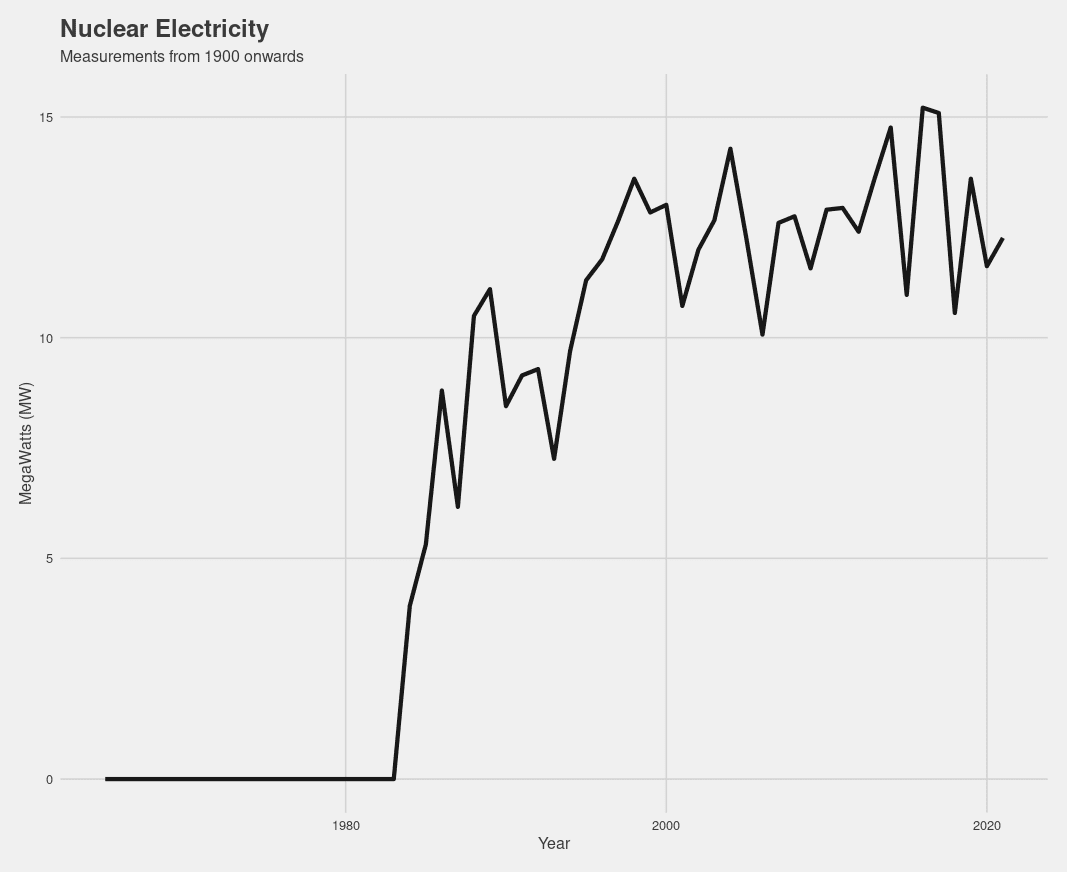
NuclearGraph%>%
filter(!is.na(nuclear_electricity)) %>%
ggplot(aes(x = year, y = nuclear_electricity)) +
geom_line(size = 1.5, alpha = 0.9) +
labs(title = "Nuclear Electricity", subtitle = "Measurements from 1900 onwards", x = "Year", y = "MegaWatts (MW)" ) +
theme_fivethirtyeight() +
theme(axis.title = element_text())
SolarGraph = wb_south_africa

SolarGraph%>%
filter(!is.na(solar_electricity)) %>%
ggplot(aes(x = year, y = solar_electricity)) +
geom_line(size = 1.5, alpha = 0.9) +
labs(title = "Solar Electricity", subtitle = "Measurements from 1900 onwards", x = "Year", y = "MegaWatts (MW)" ) +
theme_fivethirtyeight() +
theme(axis.title = element_text())
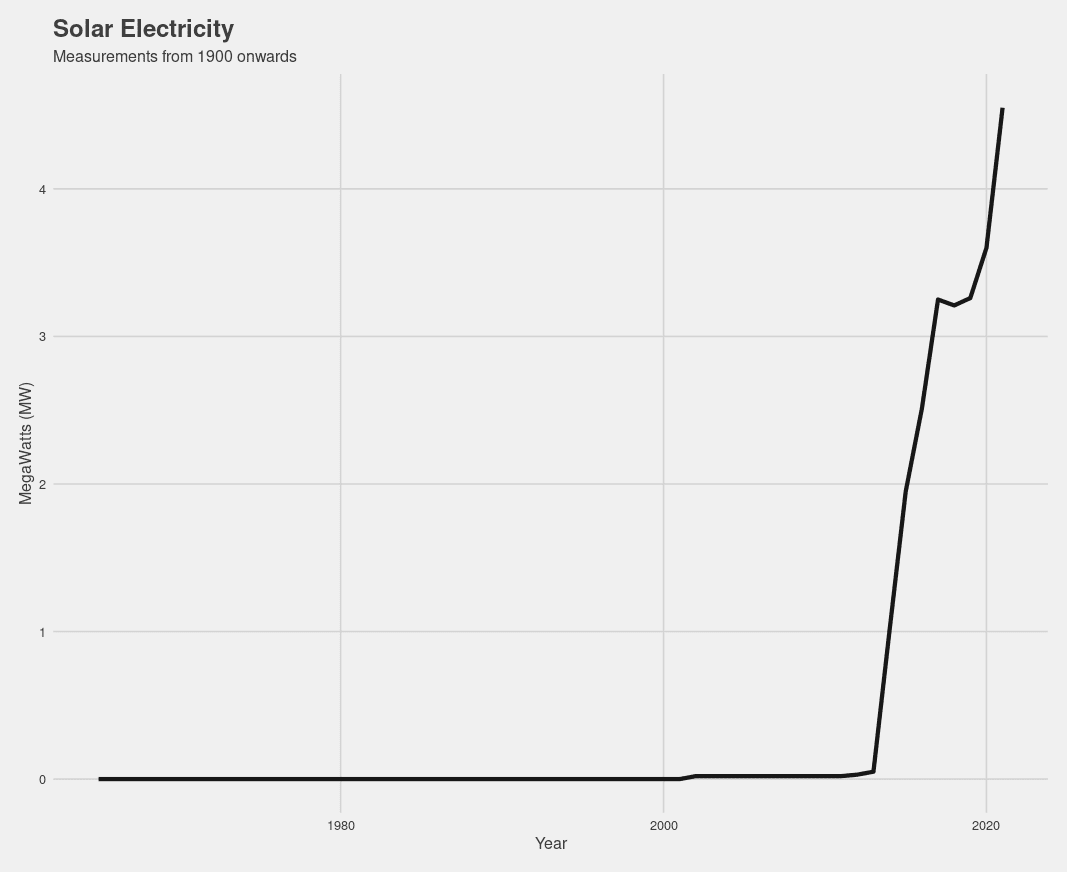
Viewing each energy type on a separate graph is easier/clearer to read, but I’ve also been seeing animated graphs used - and that’s what I wanted to try next. Along with that I wanted to plot all four types on a single graph for something more engaging.
To do this needed the dataset to be formatted differently. After some time is started noticing some issues related to some commands. This happened the most when going through tutorial steps from written/video sources that may have been connected to version updates.
Since this dataset is not that long I made th decision to copy the columns I wanted into a new .csv document and then import and work with that for the rest of this portion of the exploration. This means I can then go straight into ggplot and generate the remainder of the plots without too many missteps in-between.
The columns used in this new frame are: Year, Coal, Nuclear, Hydro, Solar, Wind. As probably stated before, a lot of the others fell away due to being not-so-different/repeated aspects of the same thing, or the figures were too small to be worth measuring at the scale of the others.
library(fs)
library(tidyr)
library(tibble)
library(readr)
library(stringr)
library(dplyr)
library(ggplot2)
library(gganimate)
library(ggthemes)
library(ggThemeAssist)

sanarrow <- read_csv(file = "all_datasets/fresh/zsanarrow.csv")
salong = sanarrow %>% pivot_longer(cols = c('Coal', 'Hydro', 'Nuclear', 'Solar', 'Wind'),
                                  names_to = 'Source',
                                  values_drop_na = TRUE,
                                  values_to = 'Units')
tibble(salong)

# A tibble: 171 × 3
   Year Source Units
  <dbl> <chr>  <dbl>
1  1965 Hydro  0.037
2  1966 Hydro  0.036
3  1967 Hydro  0.026
4  1968 Hydro  0.024
5  1969 Hydro  0.021
6  1970 Hydro  0.025
7  1971 Hydro  0.112
8  1972 Hydro  0.834
9  1973 Hydro  0.985
10  1974 Hydro  1.13
# … with 161 more rows
# ℹ Use `print(n = ...)` to see more rows
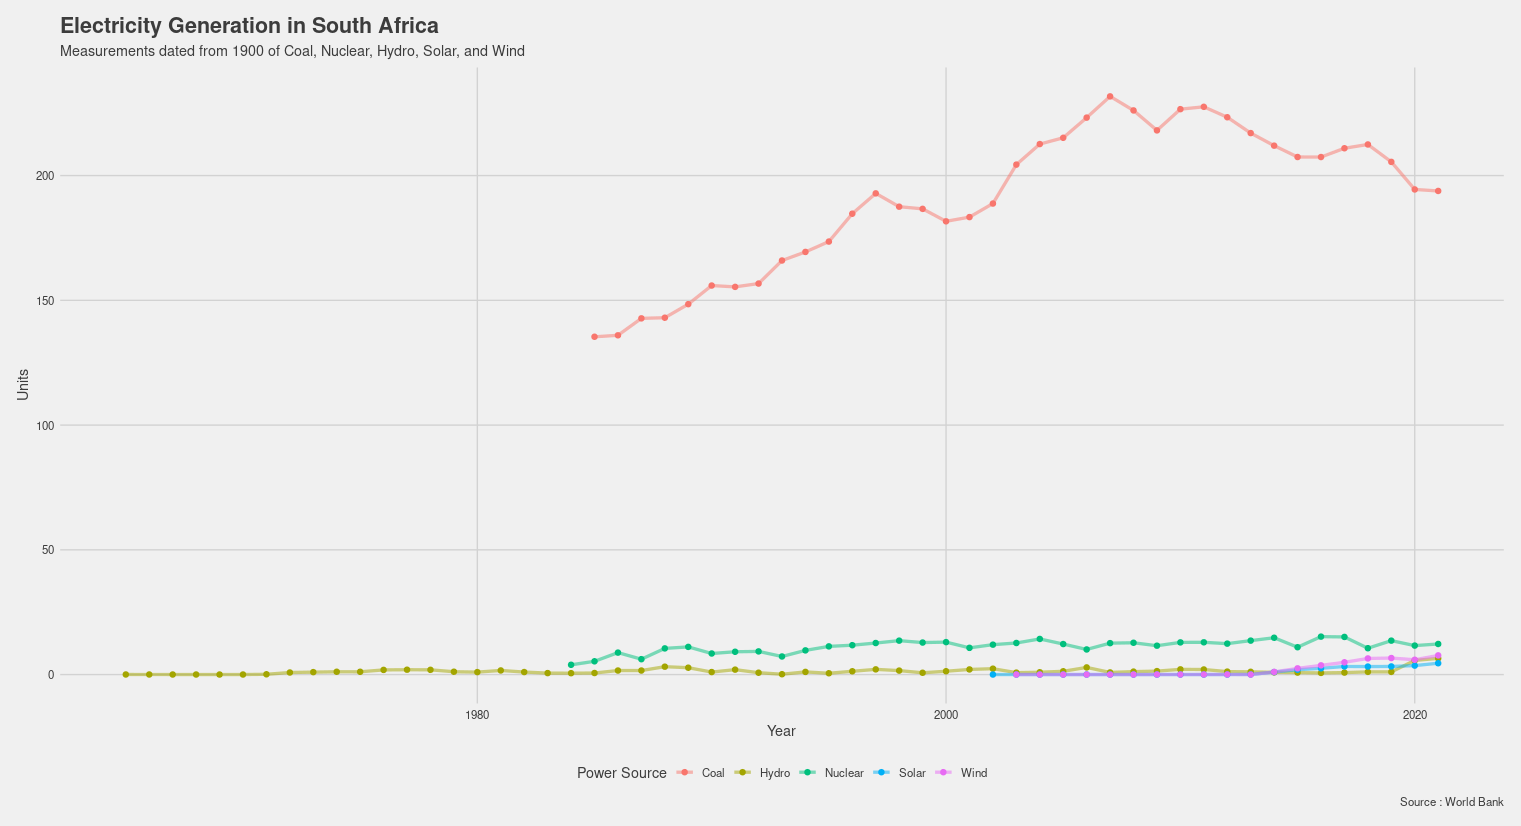
The graph makes the differences and similarities a lot clearer than the individual graphs. I was was tempted to make an animated one along a timeline, but I think what is shown in this one enough to build a good narrative around, namely how much more has to be done to diversify South Africa’s energy generation and output along a renewables route.
salong %>%
 ggplot(aes(x = Year, y = Units, color = Source)) +
 geom_line(size = 1.3, alpha = 0.5) +
 geom_point(size = 1.9) +
 labs(title = "Electricity Generation in South Africa", subtitle = "Measurements dated from 1900 of Coal, Nuclear, Hydro, Solar, and Wind", x = "Year", y = "Units", color = "Power Source", caption = "Source : World Bank") +
 theme_fivethirtyeight() +
 theme(axis.title = element_text())
Taking all the figures shown in these datasets to be accurate, I was surprised not only by the amounts, but also by the sequence the sources were introduced.
The last dataset I want to explore and present in RStudio (for now) is the latest one from Eskom that shows hourly readings since 2018. What nice about this is that it only looks at renewable energy and it introduces smaller categories that can be explored later.
This dataset is also a great opportunity to use animated graphs to track each energy type throughout the day.
> tibble(eskom_re_hourly)
# A tibble: 43,824 × 11
`Date Time Hour Beginning` Wind PV CSP `Other RE` `Total RE` `Wind Installed Capacity` `PV Installed Capacity` `CSP Installed Capacity` `Other RE Installed Capacity` Total RE Installed Capa…¹
<chr> <dbl> <dbl> <dbl> <dbl> <dbl> <dbl> <dbl> <dbl> <dbl> <dbl>
1 2018-04-01 12:00:00 AM 455. 0 17.6 12.5 485. 2078. 1474. 300 21.8 3874.
2 2018-04-01 01:00:00 AM 393. 0 39.1 12.4 444. 2078. 1474. 300 21.8 3874.
3 2018-04-01 02:00:00 AM 337. 0 39.2 12.1 389. 2078. 1474. 300 21.8 3874.
4 2018-04-01 03:00:00 AM 297. 0 38.9 12.3 348. 2078. 1474. 300 21.8 3874.
5 2018-04-01 04:00:00 AM 310. 0 25.0 12.5 347. 2078. 1474. 300 21.8 3874.
6 2018-04-01 05:00:00 AM 345. 0 0 12.1 357. 2078. 1474. 300 21.8 3874.
7 2018-04-01 06:00:00 AM 335. 8.85 0 12.1 356. 2078. 1474. 300 21.8 3874.
8 2018-04-01 07:00:00 AM 365. 289. 0.257 11.9 666. 2078. 1474. 300 21.8 3874.
9 2018-04-01 08:00:00 AM 326. 757. 42.1 11.8 1137. 2078. 1474. 300 21.8 3874.
10 2018-04-01 09:00:00 AM 298. 1023. 98.6 12.4 1432. 2078. 1474. 300 21.8 3874.
# … with 43,814 more rows, and abbreviated variable name ¹`Total RE Installed Capacity`
A look at the tibble shows that we can extract at least two (2) animated graphs - one for Renewables Generation and another for Installed Renewables Capacity. I’m wondering how many rows we’ll end up with after transforming the frame to long data…
library(fs)
library(tidyr)
library(tibble)
library(readr)
library(stringr)
library(dplyr)
library(ggplot2)
library(gganimate)
library(ggthemes)
library(ggThemeAssist)
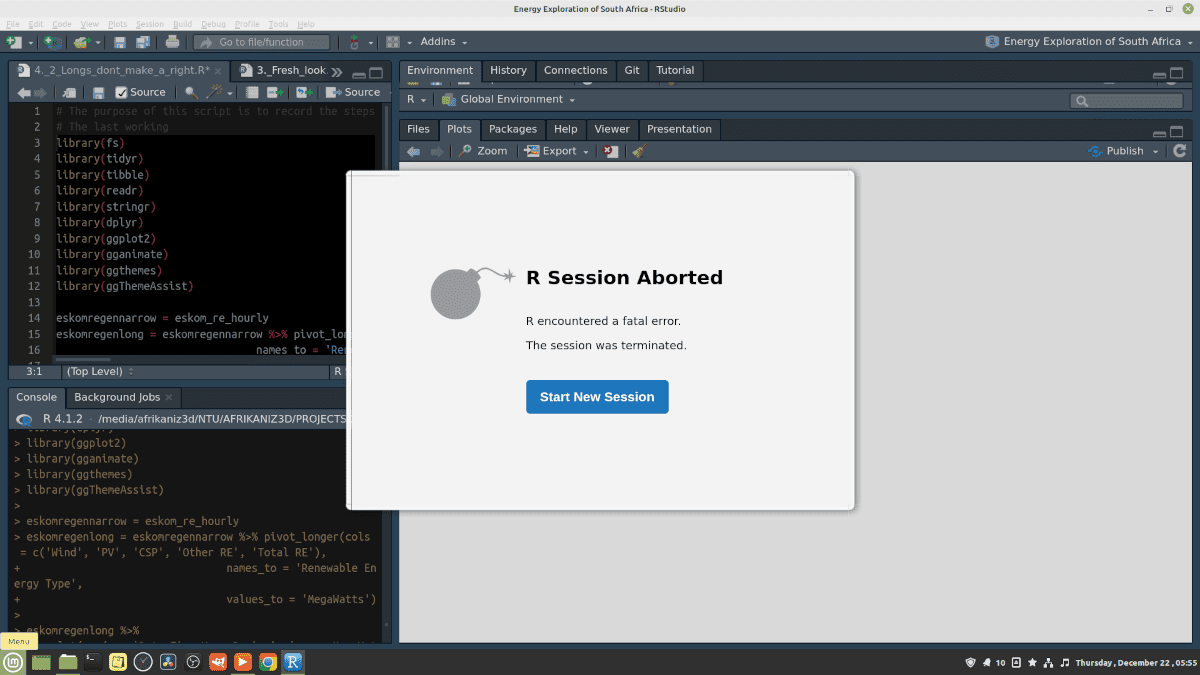
eskomregennarrow = eskom_re_hourly
eskomregenlong = eskomregennarrow %>% pivot_longer(cols = c('Wind', 'PV', 'CSP', 'Other RE'),
names_to = 'Source',
values_drop_na = TRUE,
values_to = 'MegaWatts')
eskomregenlong %>%
ggplot(aes(x = 'Date Time Hour Beginning', y = MegaWatts, color = Source)) +
geom_line(linewidth = 0.9, alpha = 0.3) +
geom_point(size = 0.5) +
labs(title = "Eskom Renewable Energy Generation", subtitle = "Hourly Measurements of Wind, Photovotaic, Concentrated Solar Power, and Other Renewable Sources ", x = "Hourly Readings", y = "MegaWatts", color = "Renewable Energy Type", caption = "Source : Eskom") +
theme_fivethirtyeight() +
theme(axis.title = element_text())
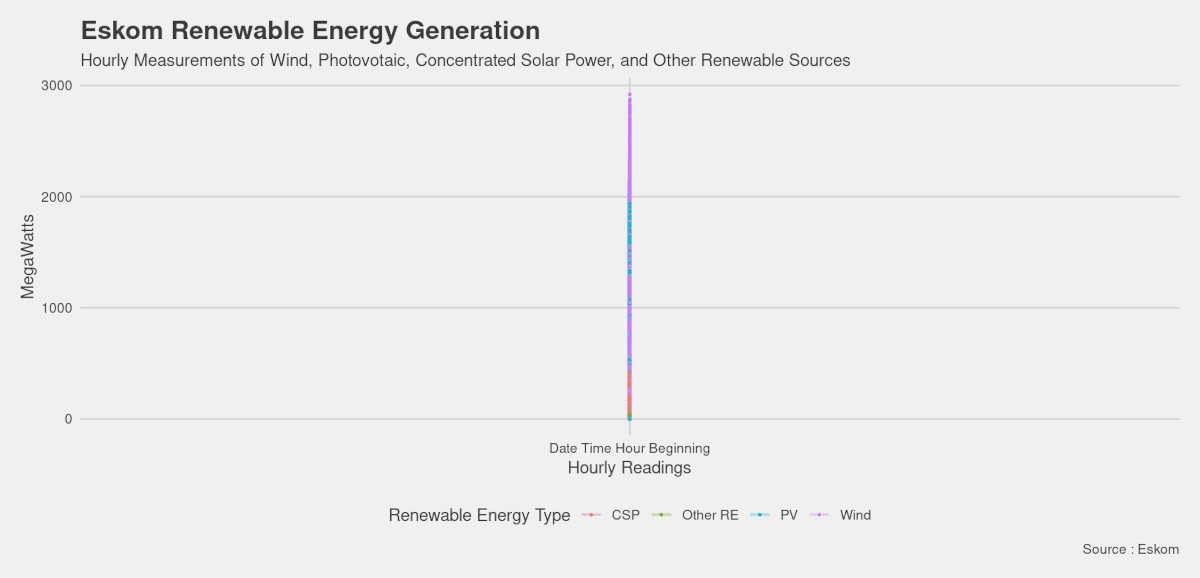
My theory for this issue is that it is most likely due to the hourly readings column not picking up as such when plotting on the graph.
It could also be solved by formatting time and date into how the column is read.
library(fs)
library(lubridate)
library(tidyr)
library(tibble)
library(readr)
library(stringr)
library(dplyr)
library(ggplot2)
library(gganimate)
library(ggthemes)
library(ggThemeAssist)

zaregennarrow <- read_csv(file = "all_datasets/fresh/zaregennarrow.csv")
zaregenlong = zaregennarrow %>% pivot_longer(cols = c('Wind', 'PV', 'CSP', 'Other RE'),
                                   names_to = 'Source',
                                   values_drop_na = TRUE,
                                   values_to = 'MegaWatts')

zaregenlong
Managed to pull the result I wanted by using the same fix from before - editing the original dataset, cleaning externally and importing the narrow format to be converted to long.
> zaregenlong
# A tibble: 157,920 × 3
   Date                   Source   MegaWatts
   <chr>                  <chr>        <dbl>
 1 2018-04-01 12:00:00 AM Wind         455.
 2 2018-04-01 12:00:00 AM PV             0
 3 2018-04-01 12:00:00 AM CSP           17.6
 4 2018-04-01 12:00:00 AM Other RE      12.5
 5 2018-04-01 01:00:00 AM Wind         393.
 6 2018-04-01 01:00:00 AM PV             0
 7 2018-04-01 01:00:00 AM CSP           39.1
 8 2018-04-01 01:00:00 AM Other RE      12.4
 9 2018-04-01 02:00:00 AM Wind         337.
10 2018-04-01 02:00:00 AM PV             0
# … with 157,910 more rows
The next step is to plot to a graph. The following lines, after a some tries at different set-ups gave this graph:
library(fs)
library(lubridate)
library(tidyr)
library(tibble)
library(readr)
library(stringr)
library(dplyr)
library(ggplot2)
library(gganimate)
library(ggthemes)
library(ggThemeAssist)
zaregennarrow <- read_csv(file = "all_datasets/fresh/zaregennarrow.csv")
zaregenlong = zaregennarrow %>%
pivot_longer(cols = c('Wind', 'PV', 'CSP', 'Other RE'),
names_to = 'Source',
values_drop_na = TRUE,
values_to = 'MegaWatts')
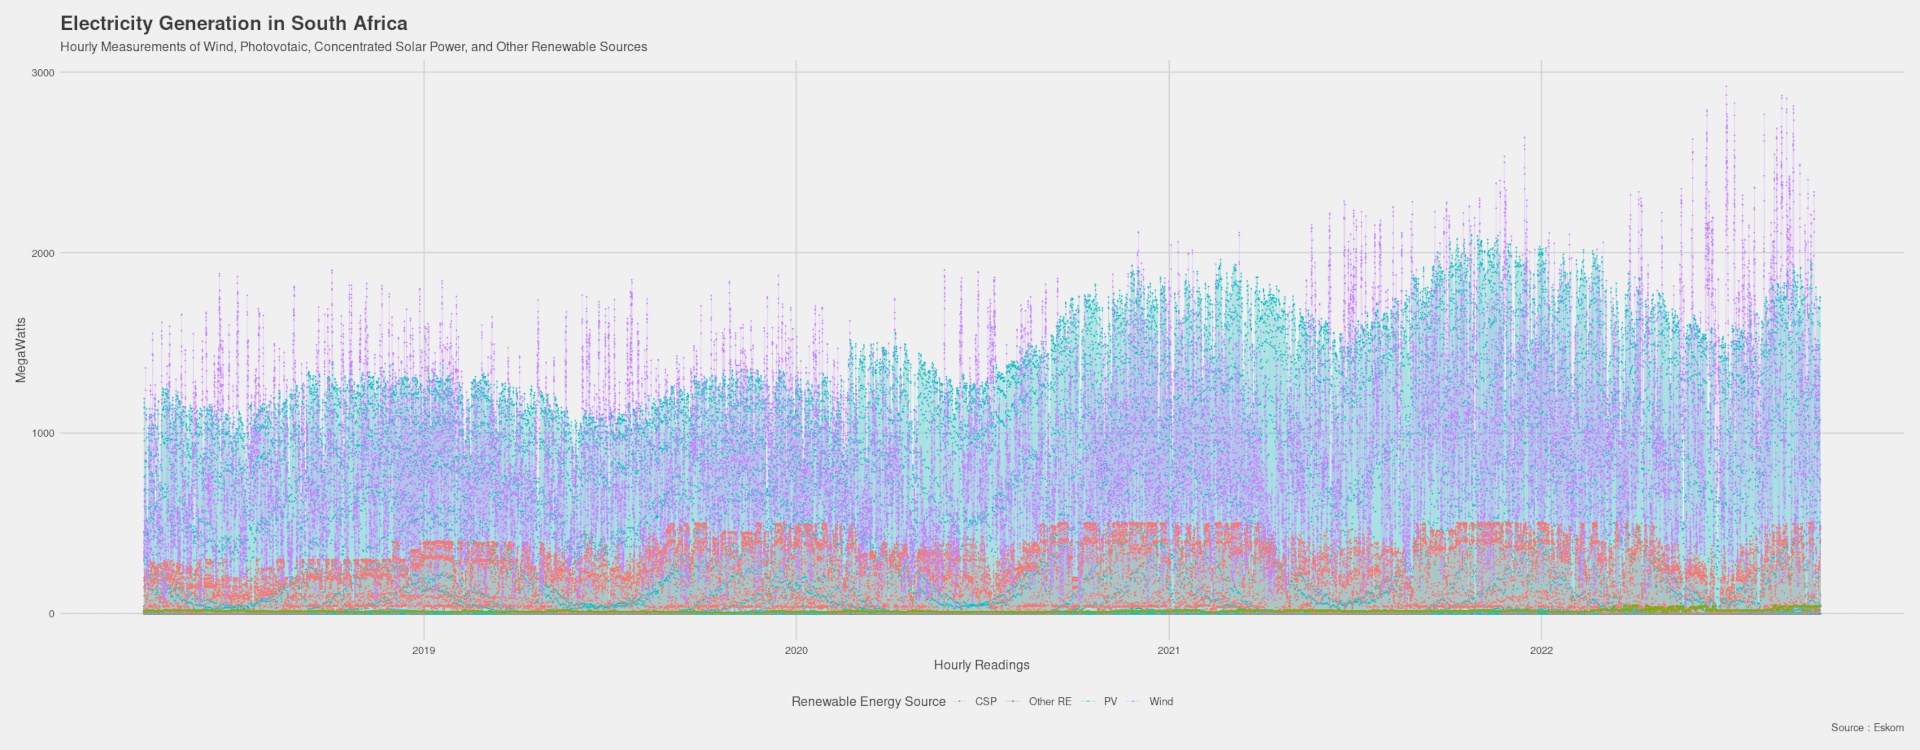
zaregenlong %>%
ggplot(aes(x = ymd_hms(Date), y = MegaWatts, color = Source, height = 500, width = 1500, res = 300)) +
geom_line(linewidth = 0.3, alpha = 0.3) +
geom_point(size = 0.1) +
labs(title = "Electricity Generation in South Africa", subtitle = "Hourly Measurements of Wind, Photovotaic, Concentrated Solar Power, and Other Renewable Sources", x = "Hourly Readings", y = "MegaWatts", color = "Renewable Energy Source", caption = "Source : Eskom") +
theme_fivethirtyeight() +
theme(axis.title = element_text())
zaregenlong
Saving it to a larger size helped to make things clearer, but this ended up being a good situation to use animated graphs to show more detail/behavior. I will try this part of the exercise again when I am able to get online for updated tutorials or am able to troubleshoot through online communities to figure out where I went wrong.
Overall looking through this dataset came up with some unexpected findings. The first is how prominent Wind is as an energy source. It commands over half of the existing capacity for renewable energy, and its generation runs 24/7 compared to the daytime hours of Solar - which peaks higher to compensate.
This concludes the RStudio portion of the South Africa energy data exploration. It will continue in Power BI linked here.
The most important takeaways I got out of this exercise: - Keep your RStudio and packages up-to-date - Get the formatting of your data right - usually in a long data format
I’ll benefit from spending more time practicing the reshaping of data as that has been the common obstacle in getting the outputs I set out looking for.
comments powered by Disqus