Maven Hospital Challenge

| DESCRIPTION | Investigating Massachussetts General Hospital (MGH) patient/visitor data, and generate a reporting tool based on insights from the data |
| TOOLS | MySQL, RStudio, Shiny, Quarto, JavaScript, HTML, CSS, Blender 3D |
| PROJECT_TYPE | Data cleaning, Data analysis, Data visualization, Shiny app development, |
| LINKS | Maven Hospital Challenge , Dashboard , Github Repo |
Quick note:

The portfolio entry was initially published on August 04, 2024. The entry you’re reading now is a revisit where I’m using different tools and applying some news skills I’ve acquired since then. I’m still in the process of building visualizations, but decided to make it visible now so that the link in my resume doesn’t lead to a 404. Thank you for understanding.

Playing the role of an Analytics Consultant for the Massachusetts General Hospital (MGH), I was tasked with building a high-level KPI report for the executive team. The report needed to answer the following questions:
1. How many patients have been admitted or readmitted over time?
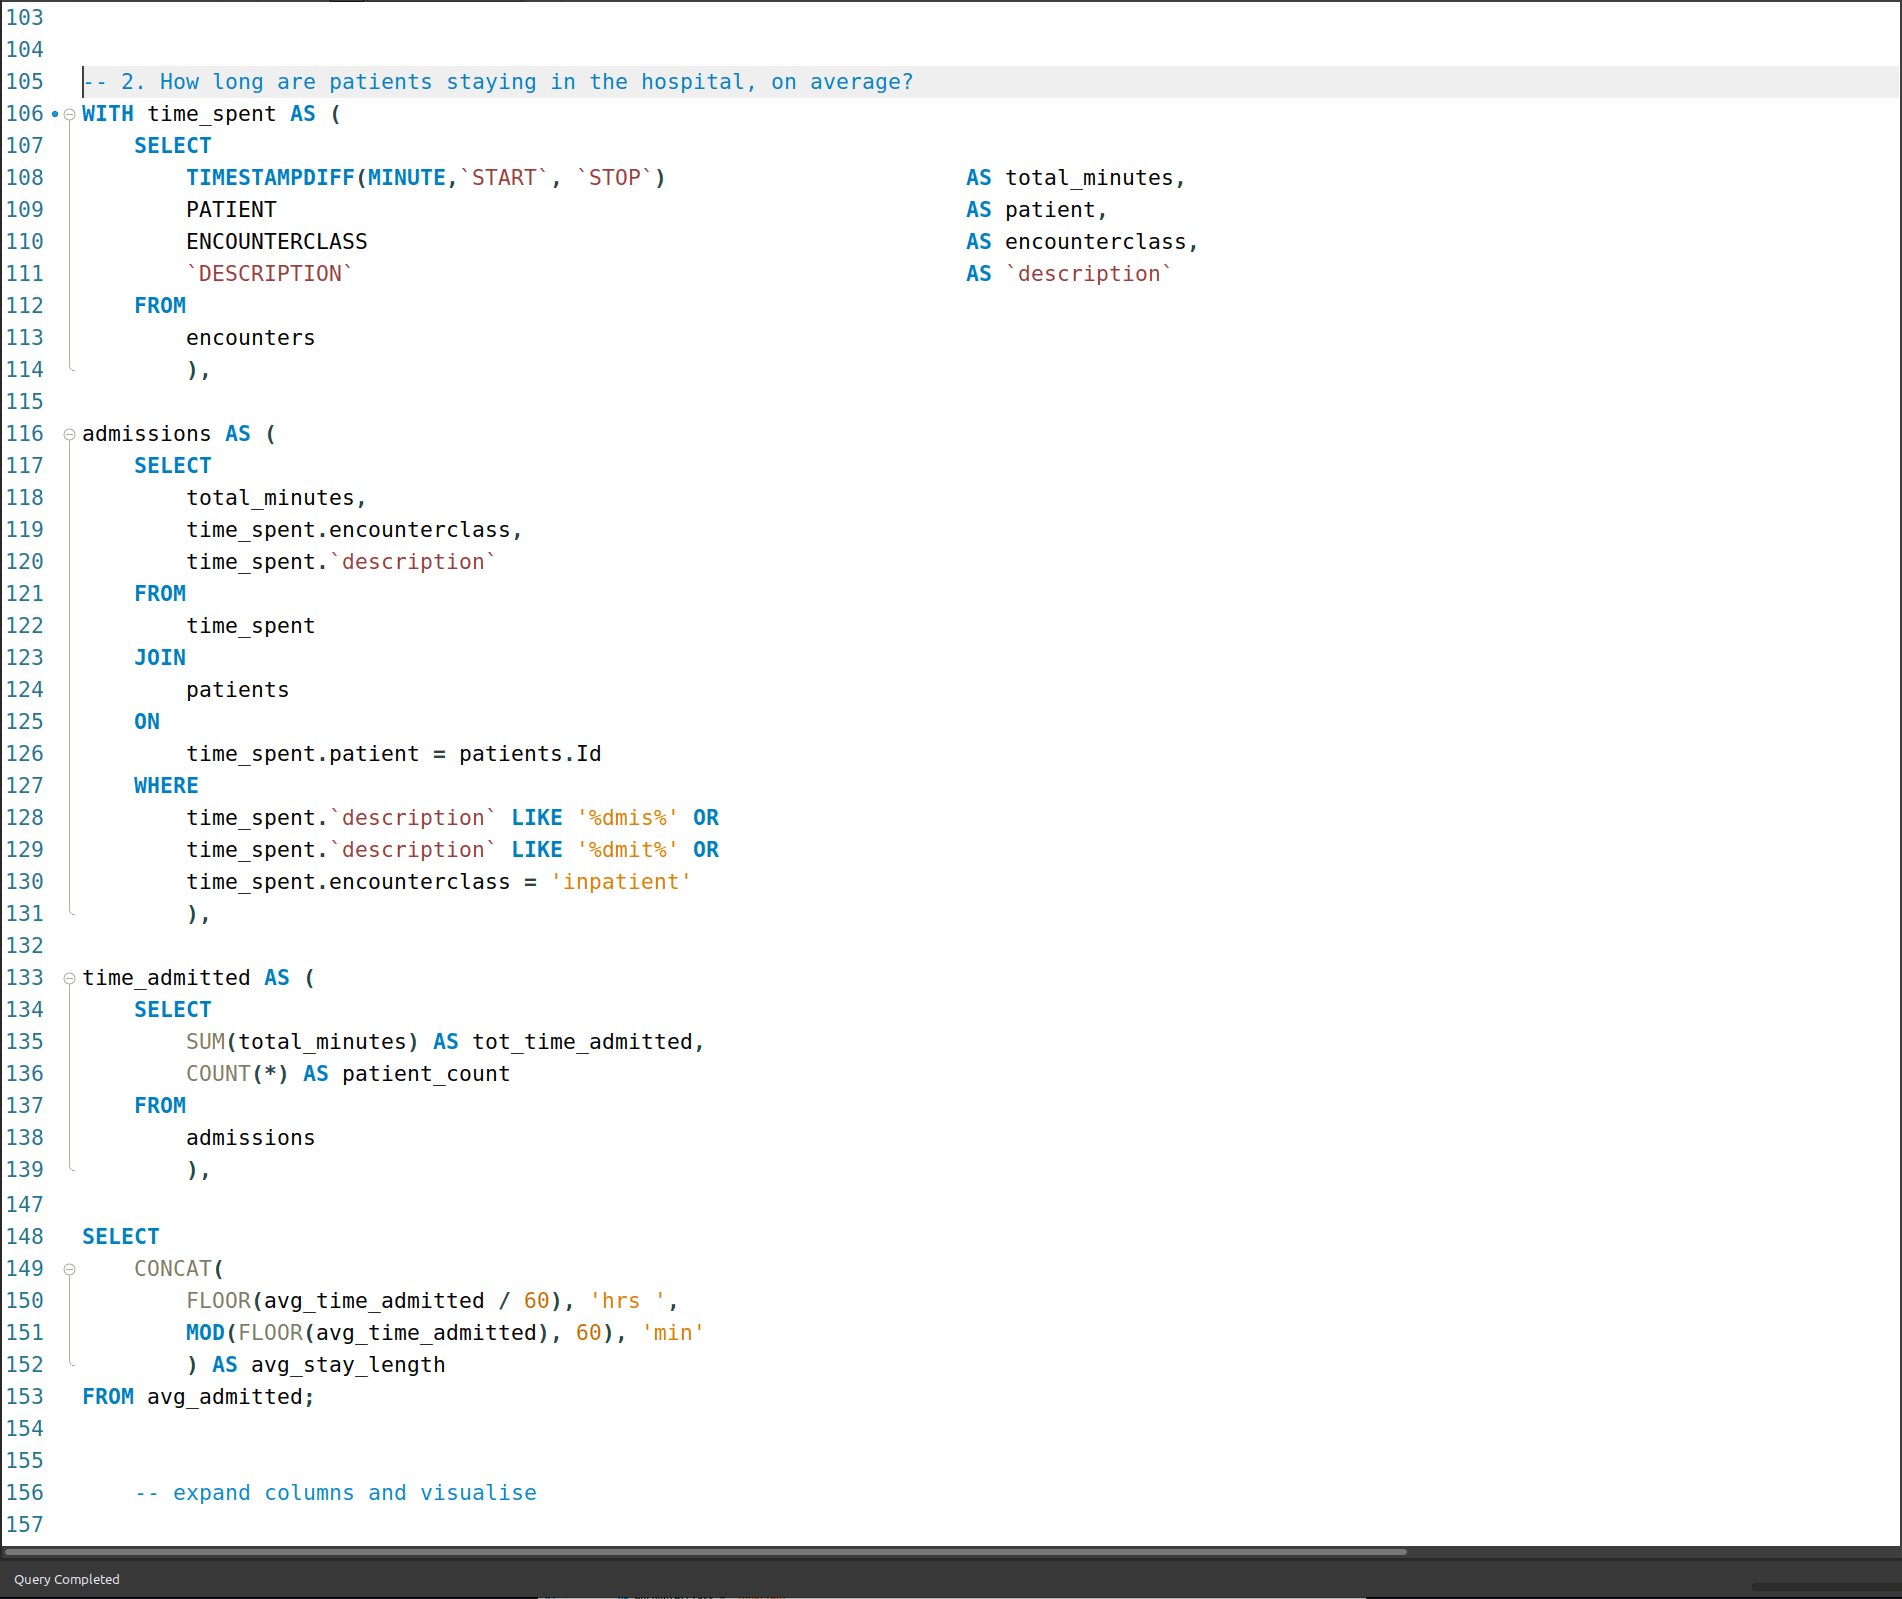
2. How long are patients staying in the hospital, on average?
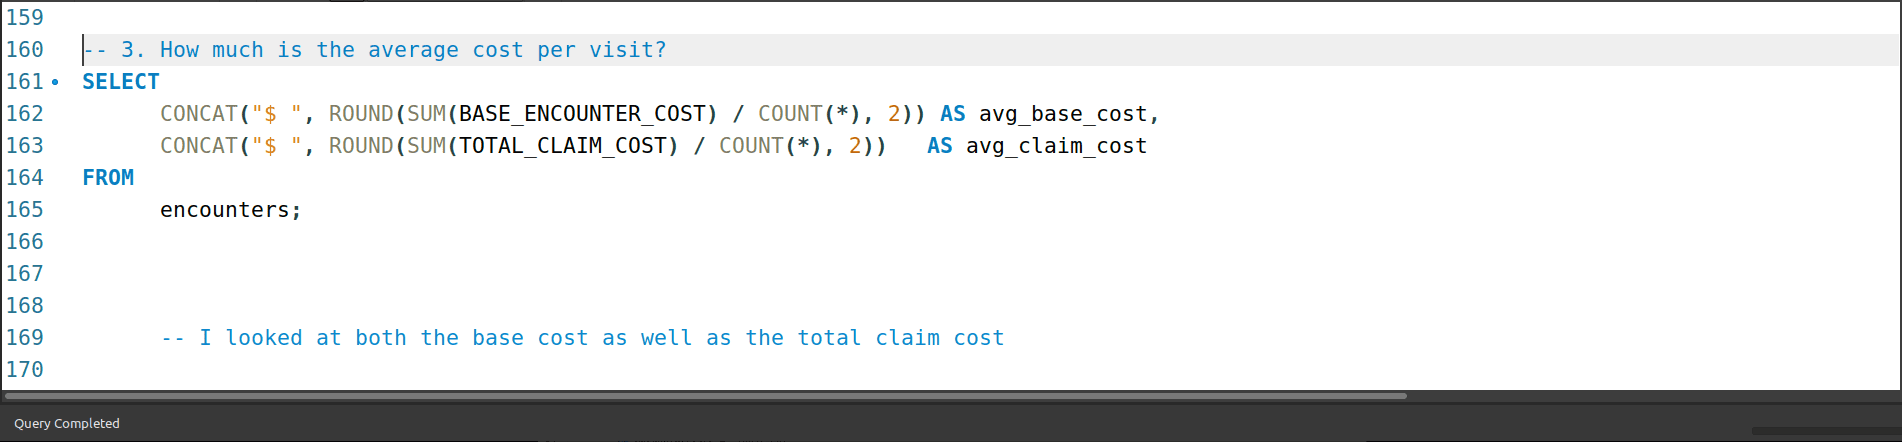
3. How much is the average cost per visit?
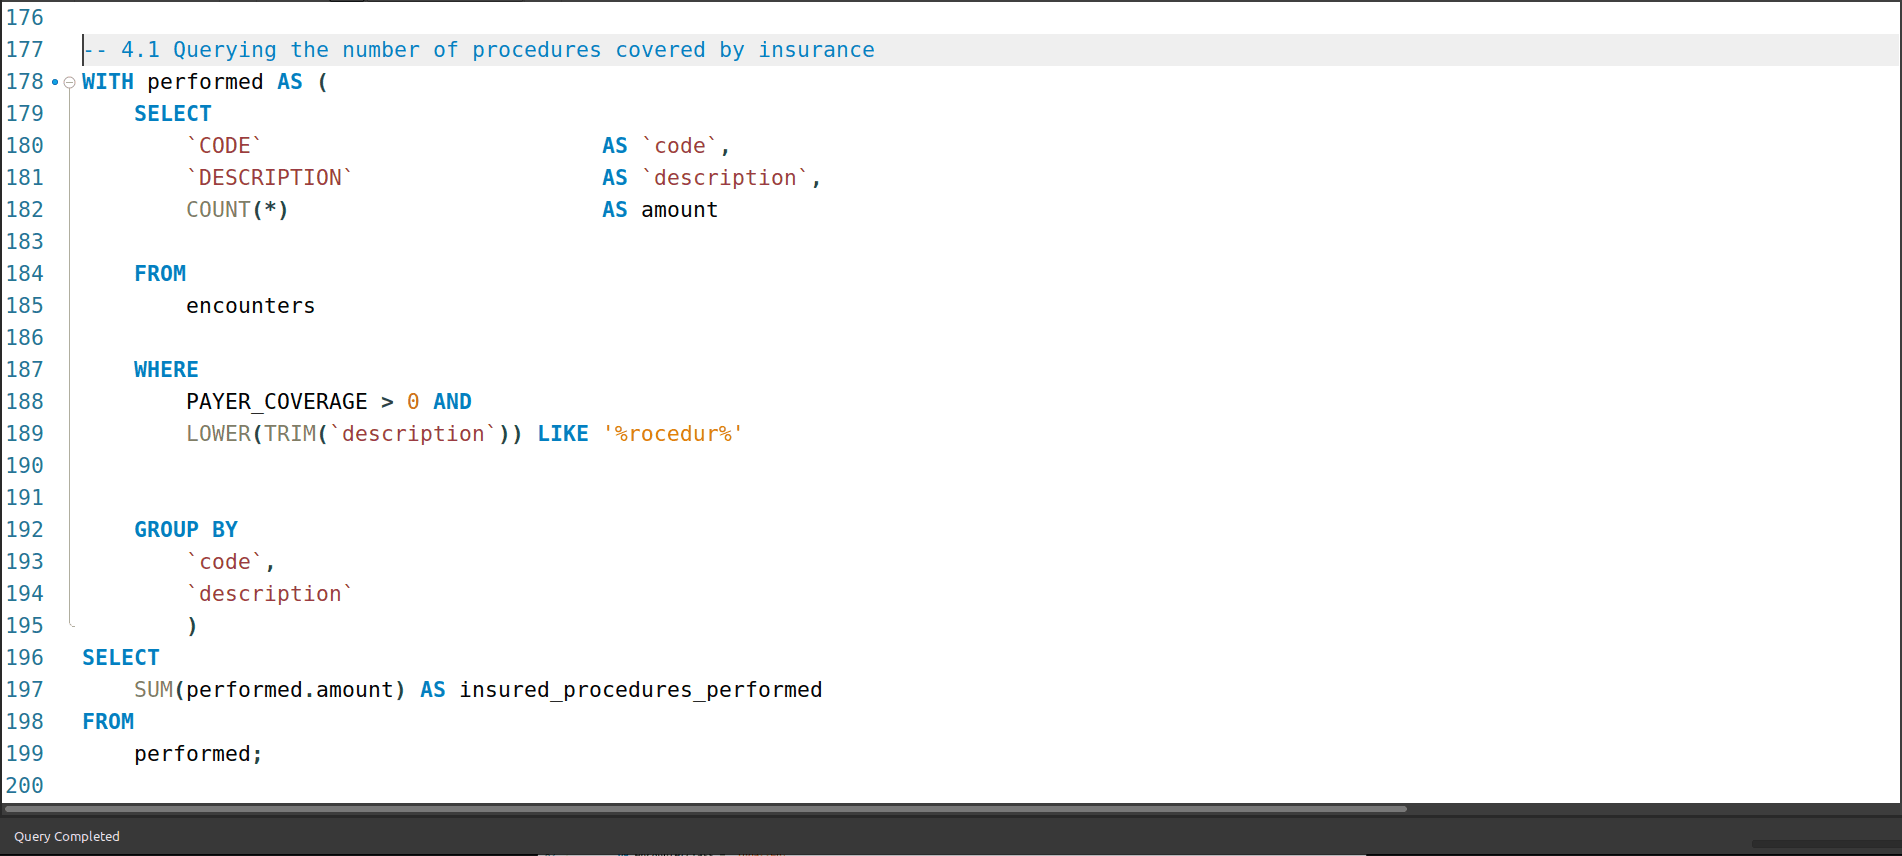
4. How many procedures are covered by insurance?

The data source
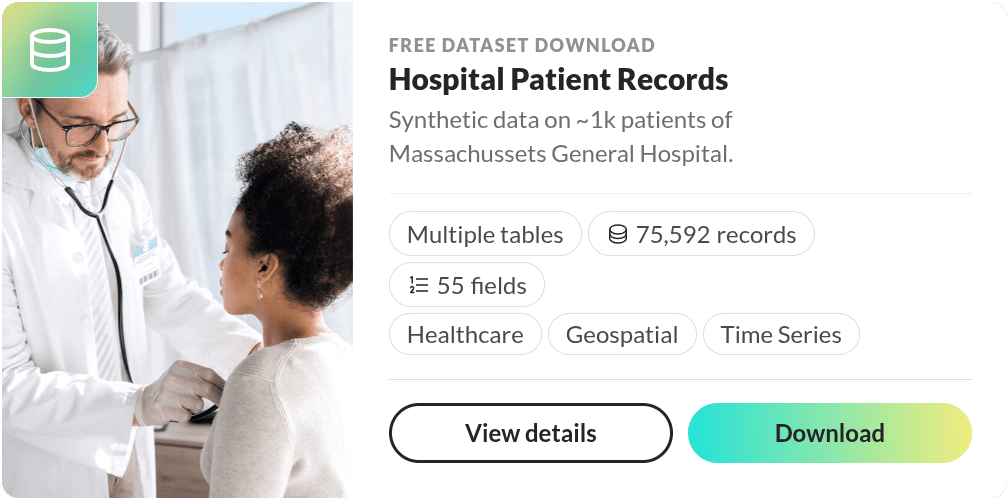
The challenge uses synthetic patient data generated by Synthea. It holds the data of approximately 1000 patients of MGH from 2011-2022, including information on their demographics, insurance coverage, and medical encounters and procedures.
The dataset is comprised of 6 tables:
- data dictionary
- encounters
- organizations
- patients
- payers
- procedures
These tables came in the form of CSV files that were imported into MySQL for the initial EDA.
Profiling the data
The patients table
Composition
The patients table is comprised of 20 columns/variables. One (1) variable, ZIP is an INTEGER. Two (2) variables (LAT and LON) are DOUBLE PRECISION for location data. Another two (2), BIRTHDATE and DEATHDATE, are DATETIME, and the remaining fifteen (15) (Id, PREFIX, FIRST, LAST, SUFFIX, MAIDEN, MARITAL, RACE, ETHNICITY, GENDER, BIRTHPLACE, ADDRESS, CITY, STATE, and COUNTY) are STRING.
Categories within the STRING data
- PREFIX: Mr., Ms., Mrs
- FIRST: various first names with an additional random three (3) numbers attached to accommodate instances of people having the same first name (Example: Timothy786)
- LAST: various last names with an additional random three (3) numbers attached to accommodate instances of people having the same last name (Example: Jones034)
- SUFFIX: JD, PhD, MD
- MAIDEN: Only used ub cases where the female patient is married (‘Mrs.’)
- MARITAL: S (single), M (married)
- RACE: asian, other, white, black, native, hawaiinan
- ETHNICITY: hispanic, nonhispanic
- GENDER: F, M
- BIRTHPLACE: various geographic locations (297 in total)
- CITY: various cities (29 in total)
- COUNTY: various counties (5 in total)
Things that stood out when looking at this data were namely the ETHNICITY column’s hispanic/nonhispanic binary - which I’ll keep in-mind for the remainder of the exploration - as well as some of the patients from other countries.
The solution for addressing repeated/same names (attaching a random 3-digit number) is worth noting for future projects.
The payers table
Composition
The payers table is comprised of 7 columns/variables. One (1) variable, ZIP is the only INTEGER. The remaining 6 variables (Id, NAME, ADDRESS, CITY, STATE_HEADQUARTERED, and PHONE) are STRING.
Categories within the STRING data
- ZIP: 6002, 46204, 40018, 6156, 55436, 60007, 21244
- NAME: Cigna Health, NO_INSURANCE, Humana, Aetna, Blue Cross Blue Shield, Dual Eligible, Medicaid, Medicare, UnitedHealthcare, Anthem
- CITY: Louisville, Indianapolis, null, Chicago, Minnetonka, Bloomfield, Hartford, Baltimore
- STATE_HEADQUARTERED: MN, null, KY, CT, MD, IL, IN
Something that stood out which I might explore further are any possible relationships around patients/procedures with Dual Eligible as their insurer.
The encounters table
Composition
The encounters table is comprised of 14 columns/variables. One (1) variable, REASONCODE is the only BIGINT. Three (3) variables (BASE_ENCOUNTER_COST, TOTAL_CLAIM_COST, and PAYER_COVERAGE) are DOUBLE PRECISION. There is another single variable (CODE) that is an INTEGER, and two (2) variables (START and STOP) that are TIMESTAMP. The remaining seven (7) variables (Id, PATIENT, ORGANIZATION, PAYER, ENCOUNTERCLASS, DESCRIPTION, and REASONDESCRIPTION) are all STRING.
3.3.2 Categories within the STRING data
- ENCOUNTERCLASS: wellness, outpatient, emergency, inpatient. urgentcare, ambulatory CODE: Forty-five (45) numerical strings that are between 7 and 9 digits in length
- DESCRIPTION: Fifty-three (53) descriptions for the types of encounters. Examples include “Postnatal visit” and “Cardiac Arrest”
- REASONCODE: Seventy-four (74) numerical strings of varying length (drastic in some cases)
- REASONDESCRIPTION: Full-text description, corresponding with REASONCODE
Some of the descriptions are vague, like “Encounter for problem”, and rely on the REASONDESCRIPTION to give more clarity. I think looking into this more will be helpful in suggesting any adjustments to get more use out of the columns in these situations.
The procedures table
Composition
The procedures table is comprised of 9 columns/variables. The first twp (2) variables (START and STOP) are TIMESTAMP. Two (2) variables (CODE and REASONCODE) are BIGINT. BASE_COST is the only INTEGER, and the remaining four (4) variables (PATIENT, ENCOUNTER, DESCRIPTION, and REASONDESCRIPTION) are all STRING.
Categories within the STRING data
- CODE: 157 numerical string data in ranging digit length that represent procedures
- DESCRIPTION: 163 text string data describing the procedures performed
- REASONCODE: Forty-seven (47) numerical strings of various length
- REASONDESCRIPTION: Forty-seven (47) text string data describing the reasons for the performed procedures
The thing that stood out for me here was the inclusion of a null value in the REASONDESCRIPTION column I’ll look further into to see if the cause can be identified, and whether anything could be done to address it.
Answering the questions, then exploring the data further
The first time I worked through this project, I just focused on tables and queries that directly answered the questions. This time round I’ll do the same, but then follow that up by expanding the exploration to the other tables to see what more can be learned.
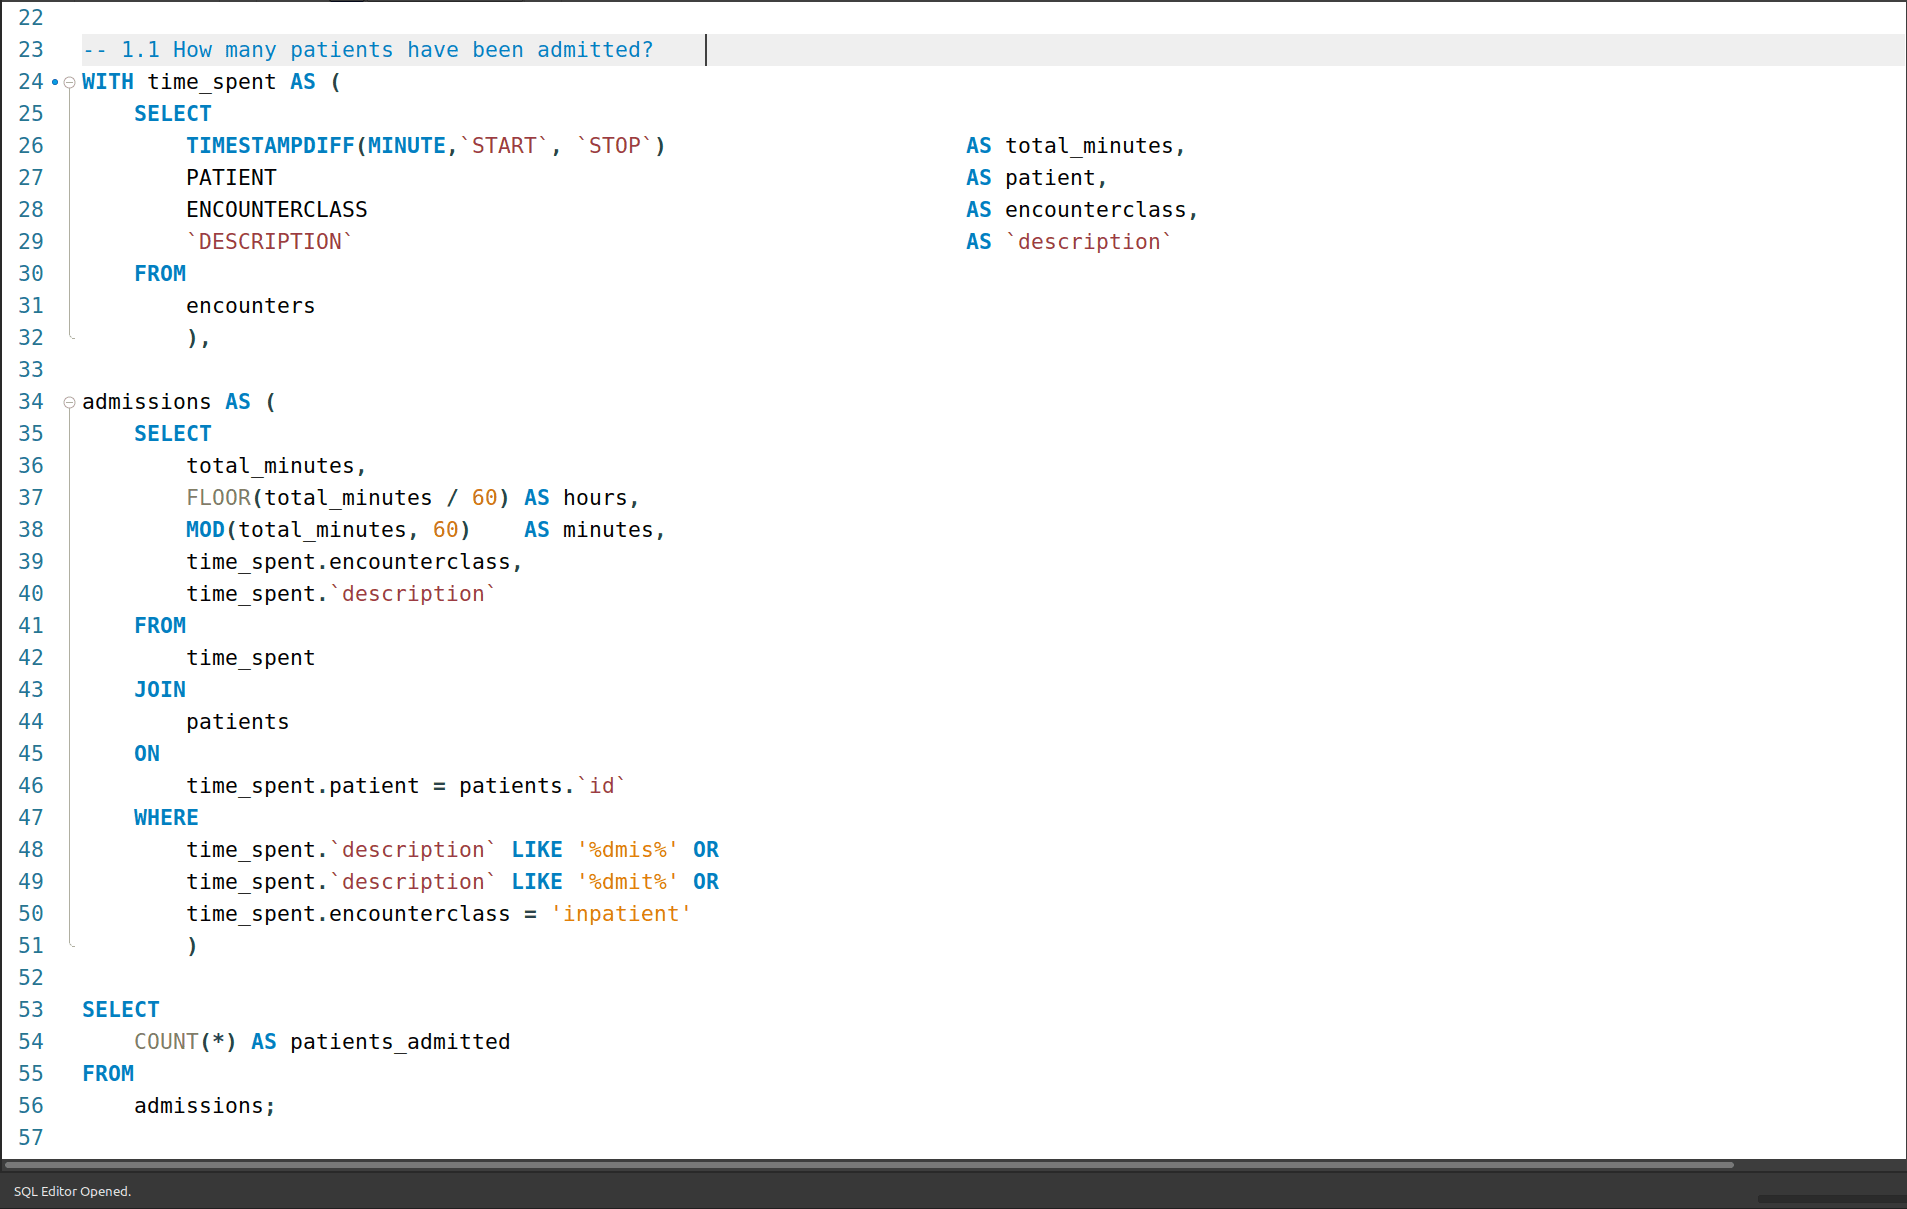
1a. How many patients have been admitted?
There were 1 880 patients admitted. To answer this I needed to first look at and understand what constituted being “admitted” to the hospital - rather than a visit. some online queries revealed that you could be admitted for as little a time as two (2) hours, and some procedures, regardless of how long, could be done without needing to be admitted.
For this reason, I chose to only look for patients that had the variations of the word “admitted/admission” used in the DESCRIPTION column in the encounters table, or those that had an ENCOUNTER_CLASS of “inpatient” as these two conditions either explicitly state there is admission or admission is the condition for the class designation.

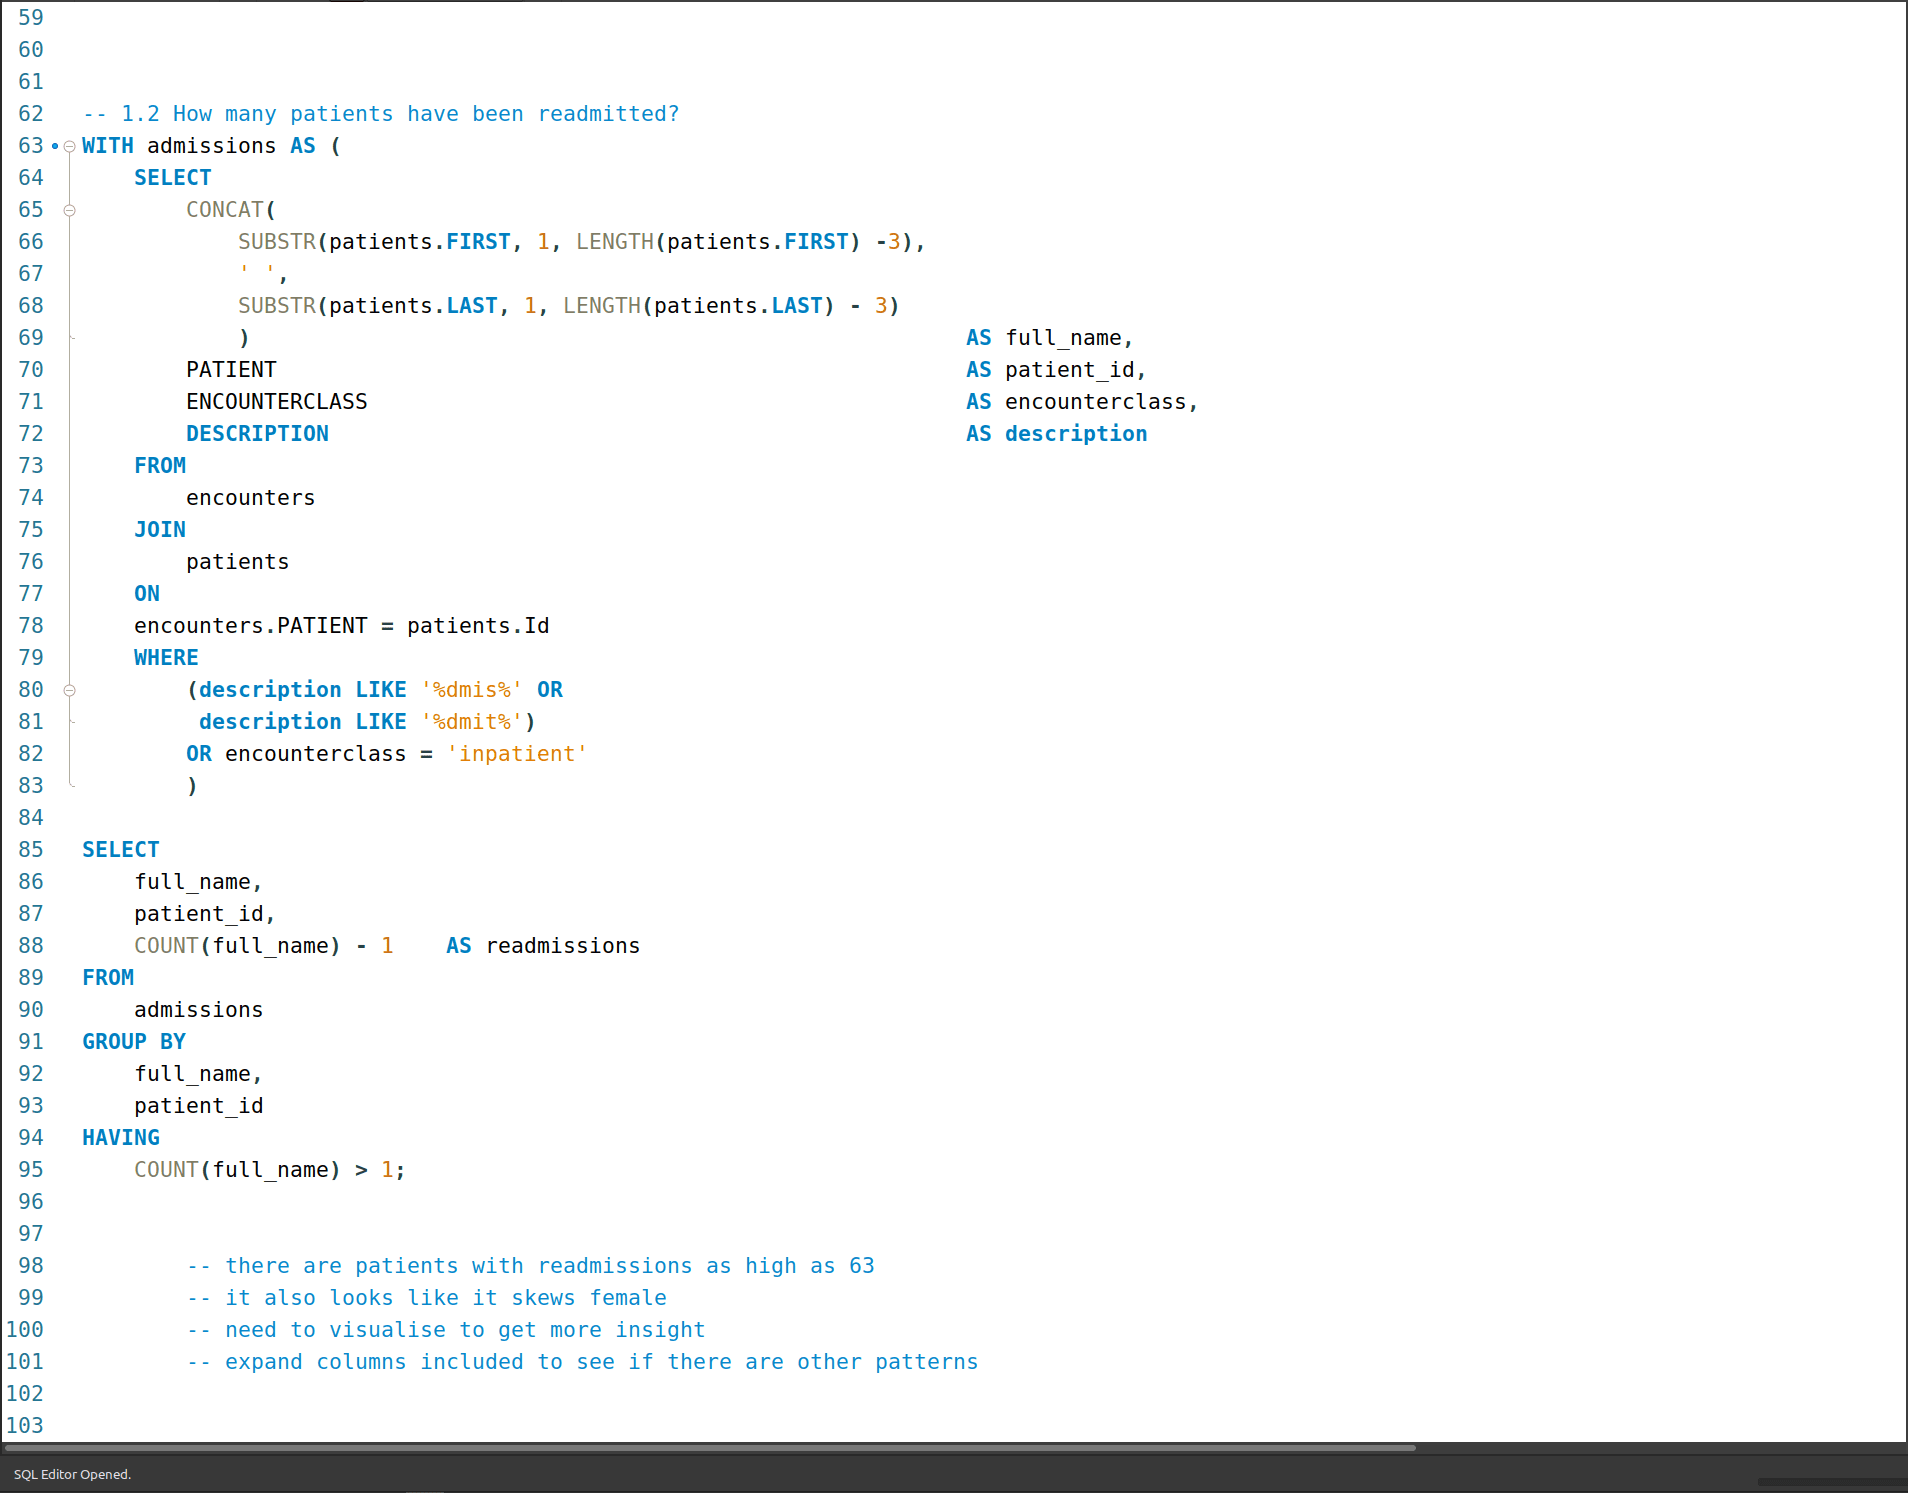
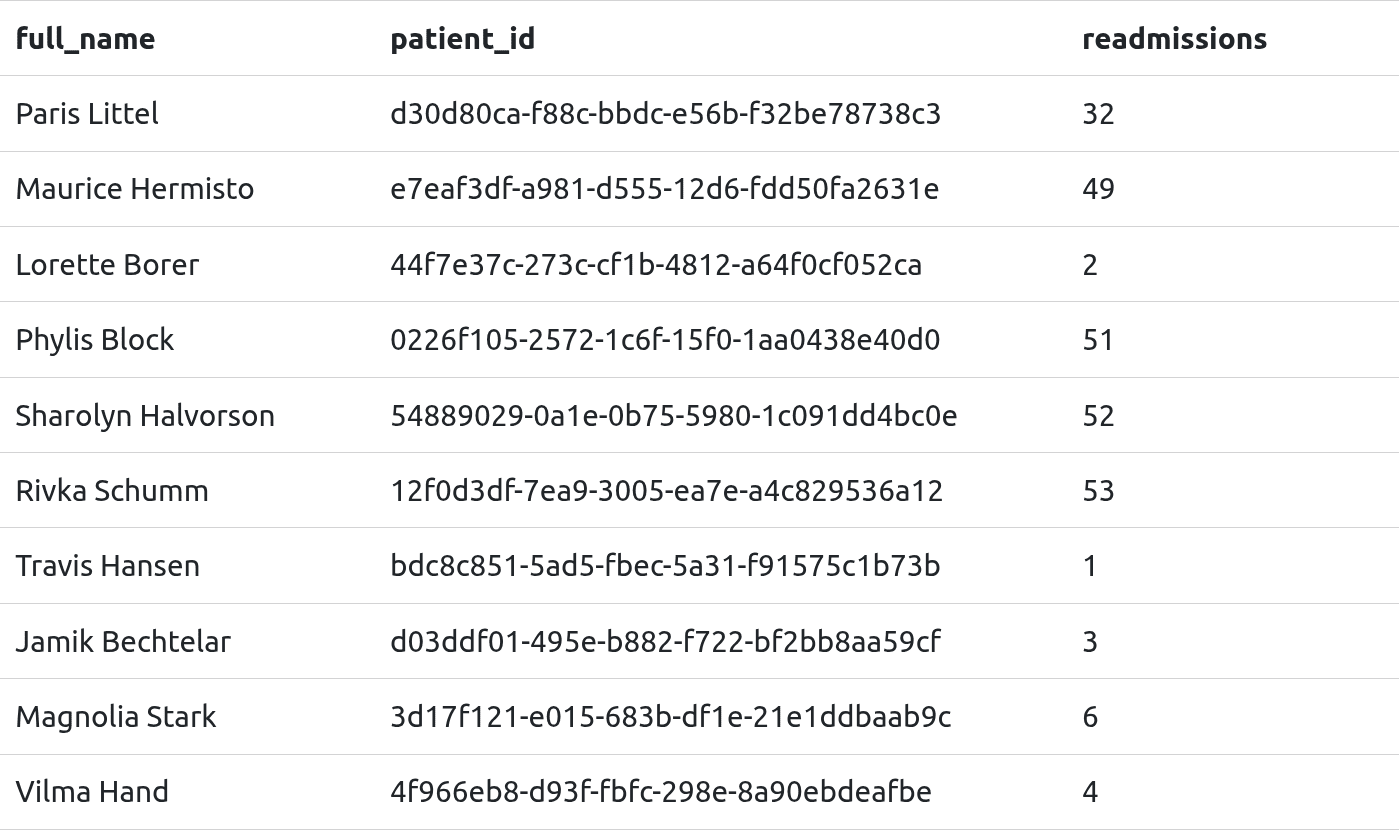
1b. How many patients have been readmitted?
There are 247 patients that have been readmitted. To answer this question took the query from 1a. and applied an additional condition that filtered for COUNT() of the patient column with a value greater than one (1). To account for the initial admission I included a “- 1” to the COUNT() for admissions - so it only now shows patients that have been readmitted.

2. How long are patients staying in hospital, on average?

3. How much is the average cost per visit?
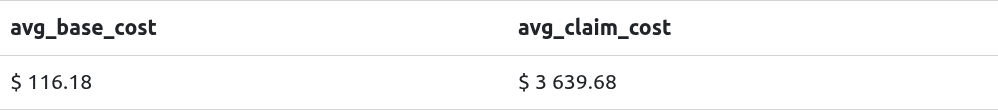
The average cost of a visit was $116.18 (base), and $3 639.68 (with a claim). The encounters table was used to answer this question where I looked at both the base cost as well as the total claim cost to add some context related to insurance.
4. How many procedures are covered by insurance?
Of the 47 701 recorded procedures from 2011-01-02 to 2022-01-29, 8 228 (17.24%) procedures were covered by insurance.

4.1 What percentage of procedures performed were insured?
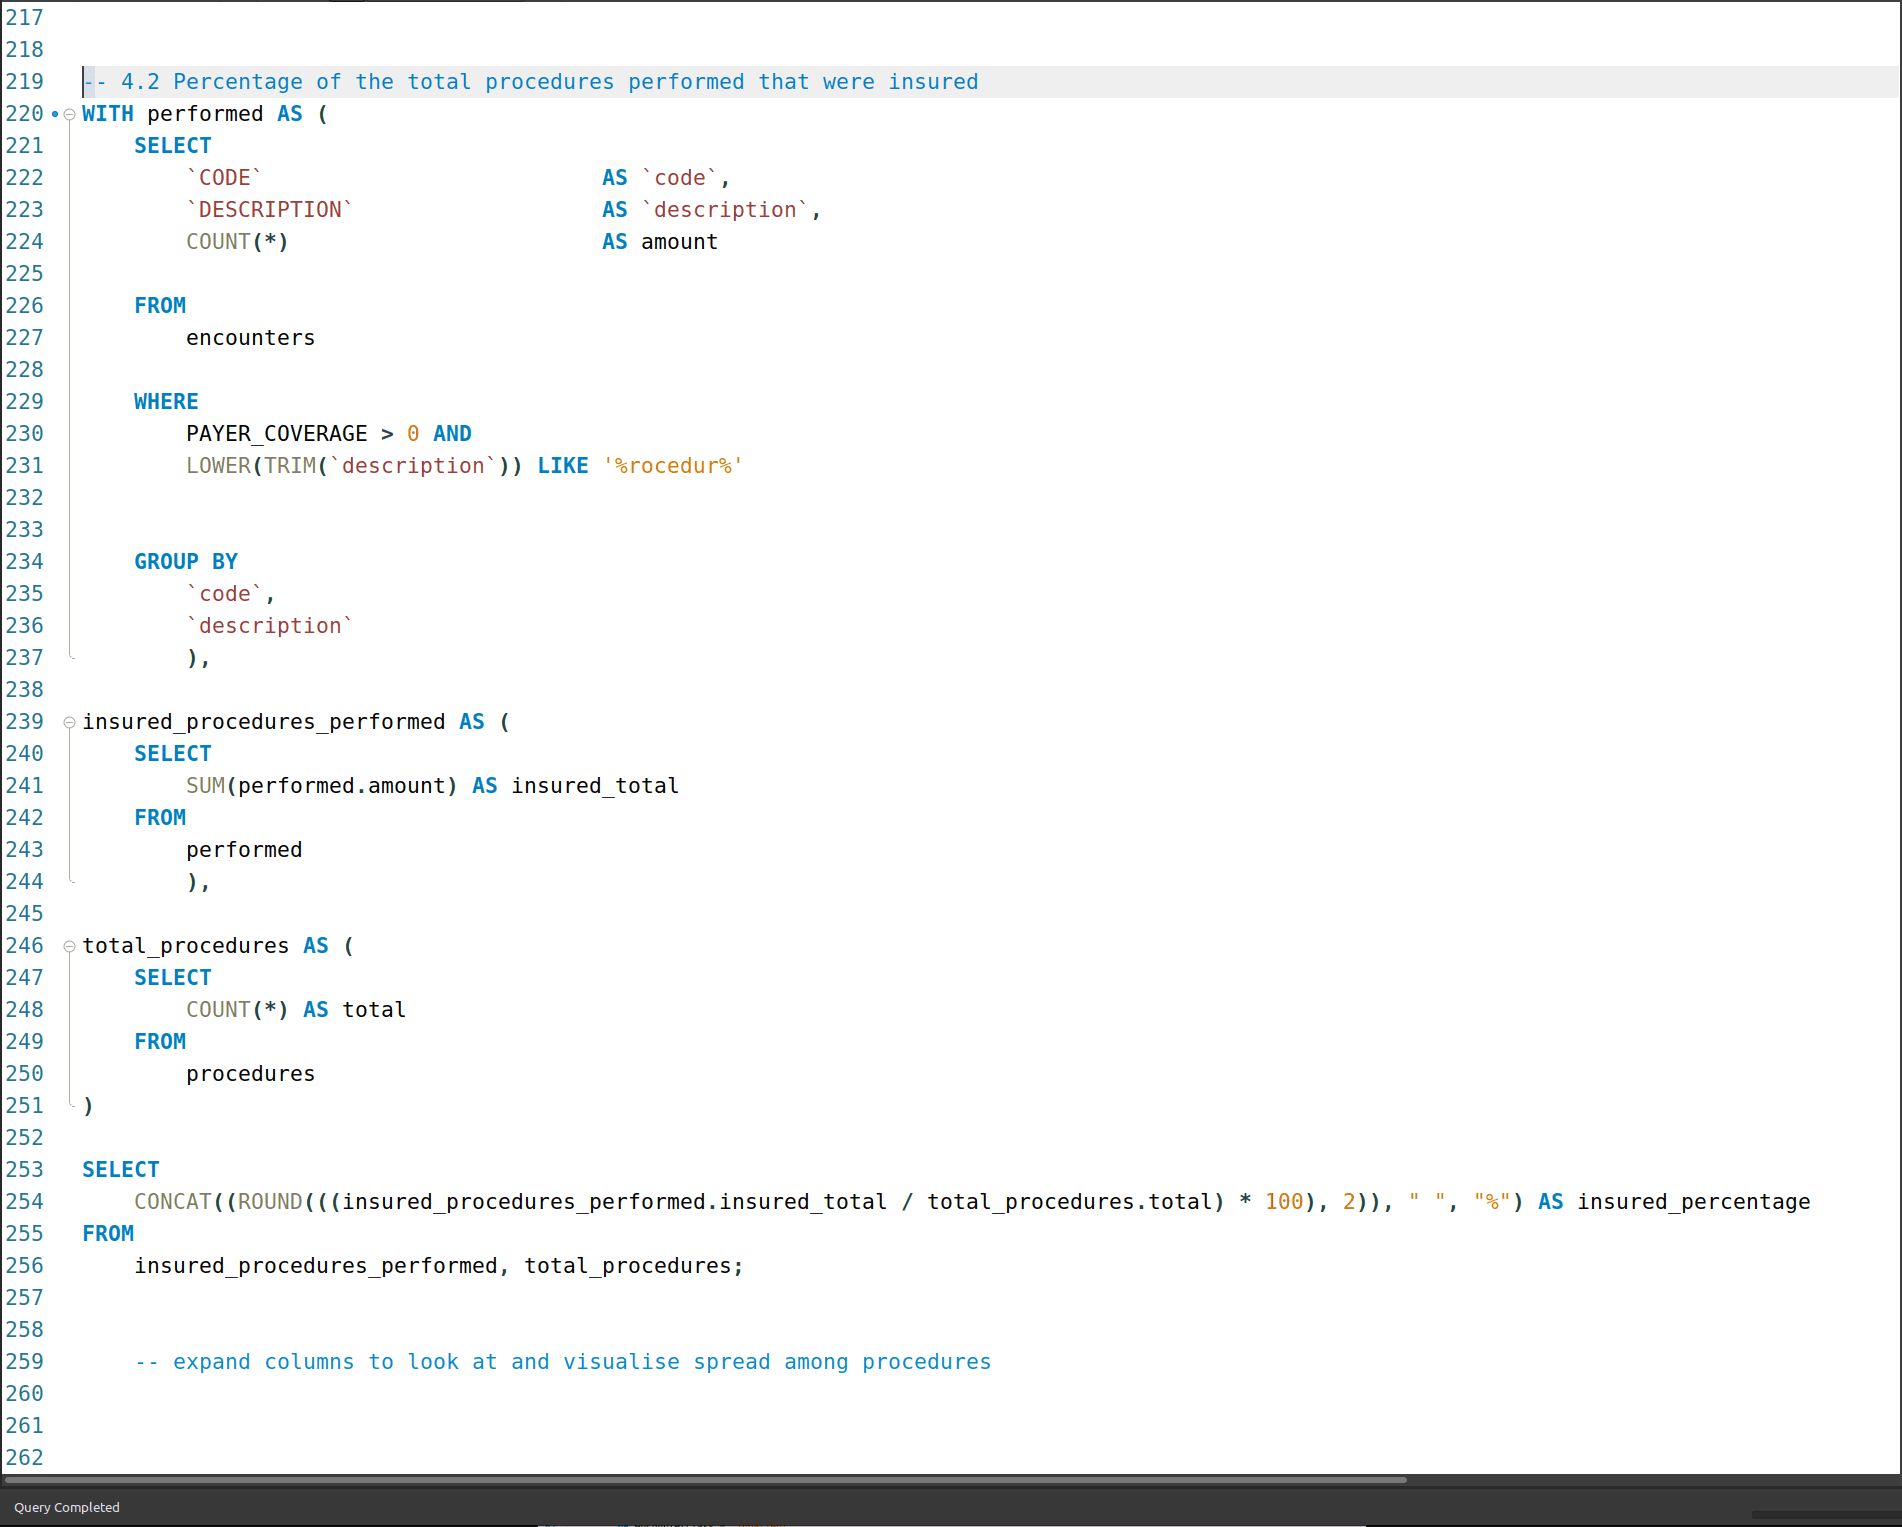

4.2 What are the 10 most-covered (countwise) procedures?
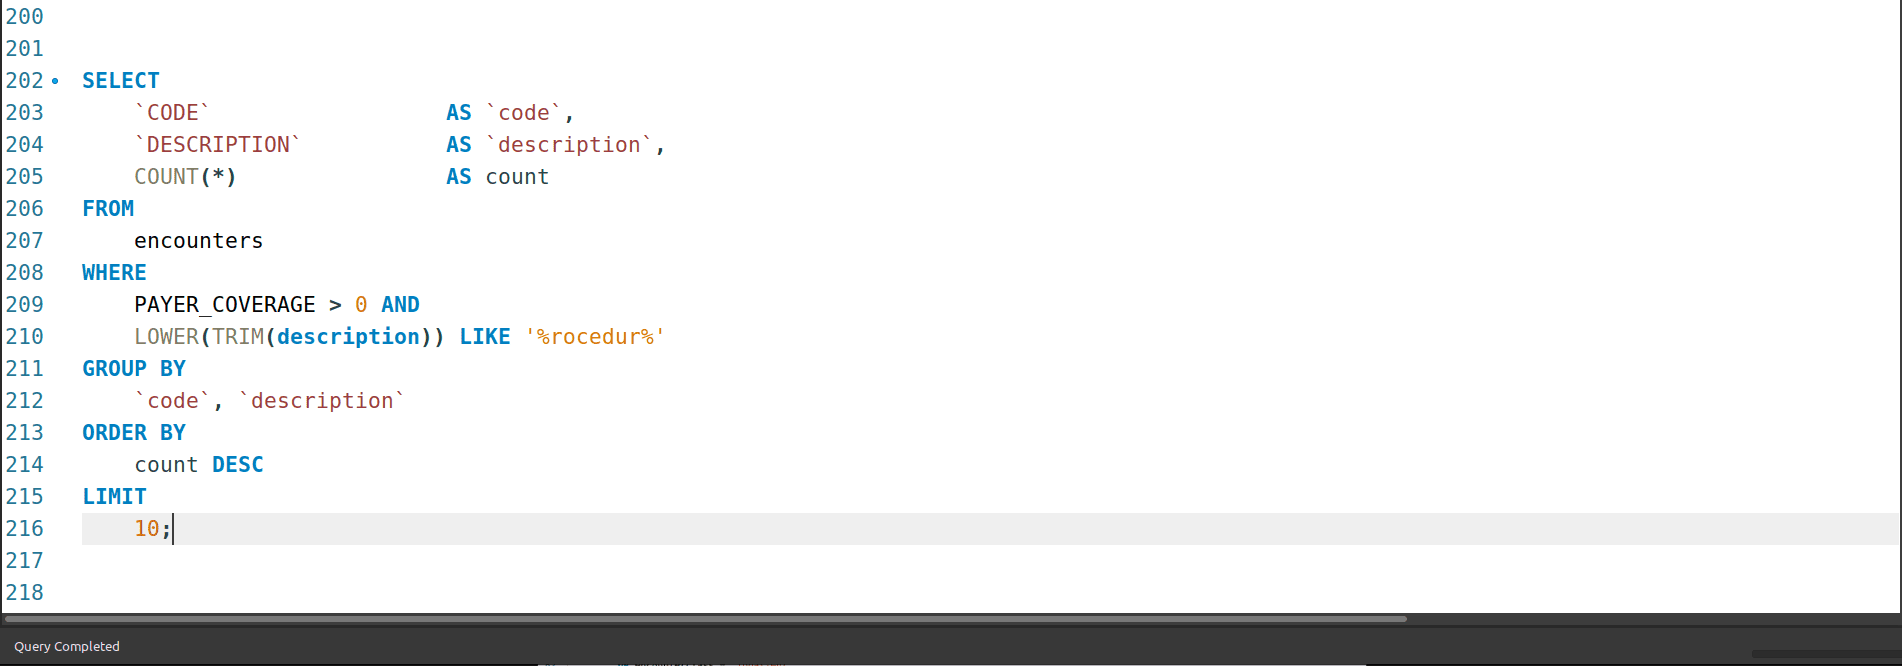
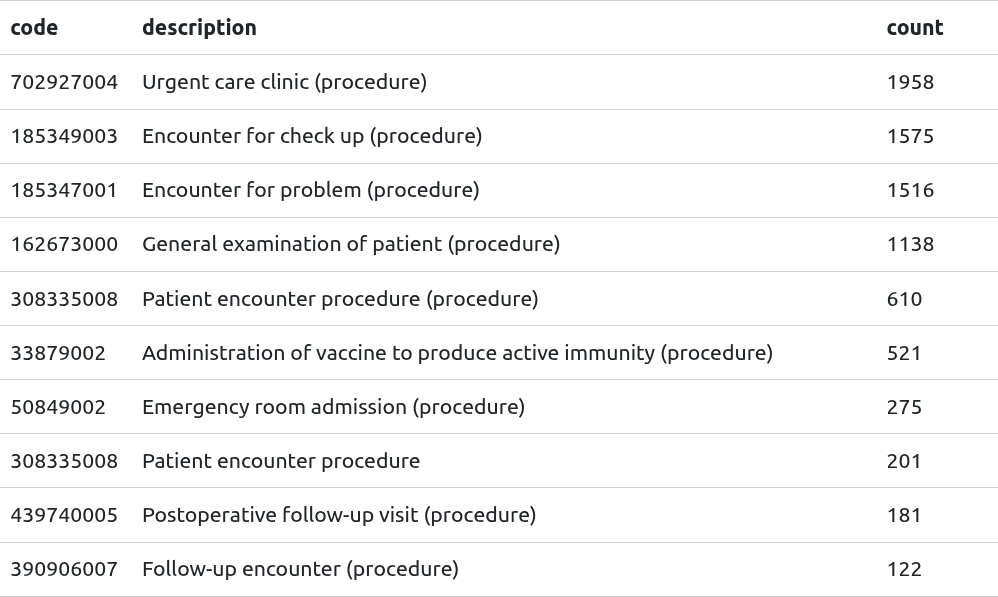
(What does this table look like when ranking by total coverage amount?)
Procedure length and anonymisation
Something I noticed while looking through result sets was that some procedures had the same duration, no matter the day or patient. This was most evident with childbirths - they were exactly 15 minutes long. Here’s a snippet:
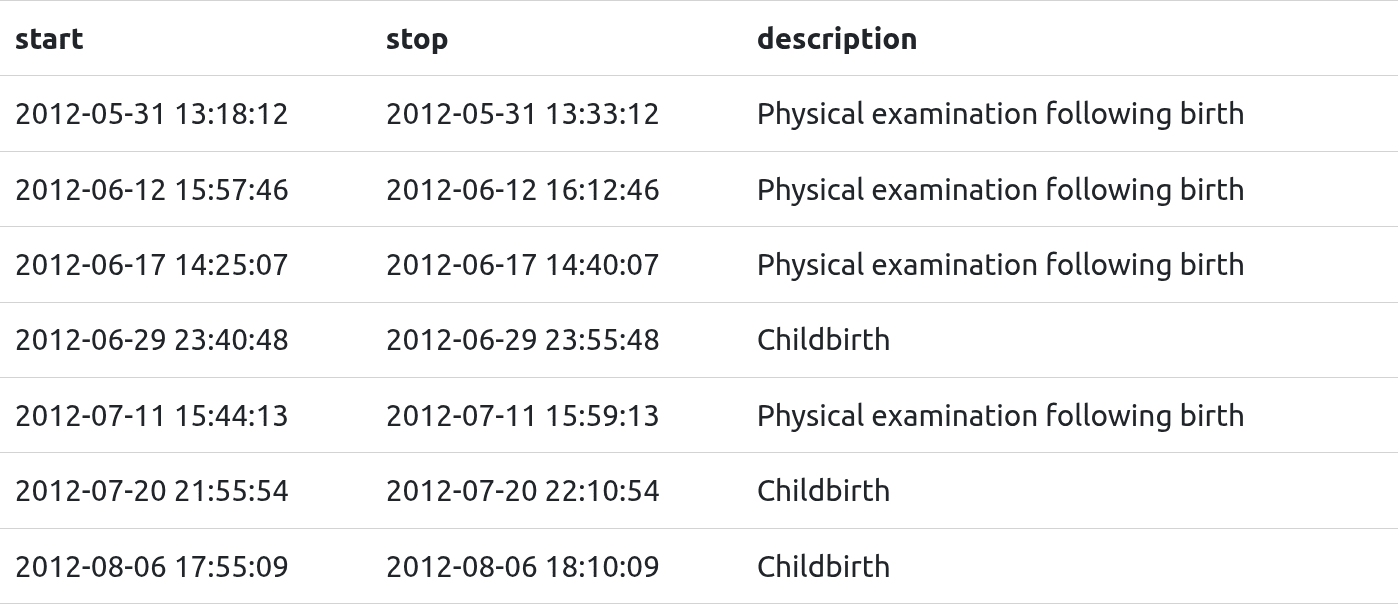
I looked into this more and learned that this is a common method anonymisation to protect patients in sensitive situations.
Wondering if there were more instances of this, I queries the lengths of all procedures to see if a similar pattern materialised.
What are the common procedure lengths?
I created a series of CTEs that isolated the columns of interest, used them to create a new column, total_minutes, and using that to then look at the range of times for each procedure.
Looked at the quickest to the longest, often finding additional cases where procedures of the same time had the same duration - much like the childbirths.
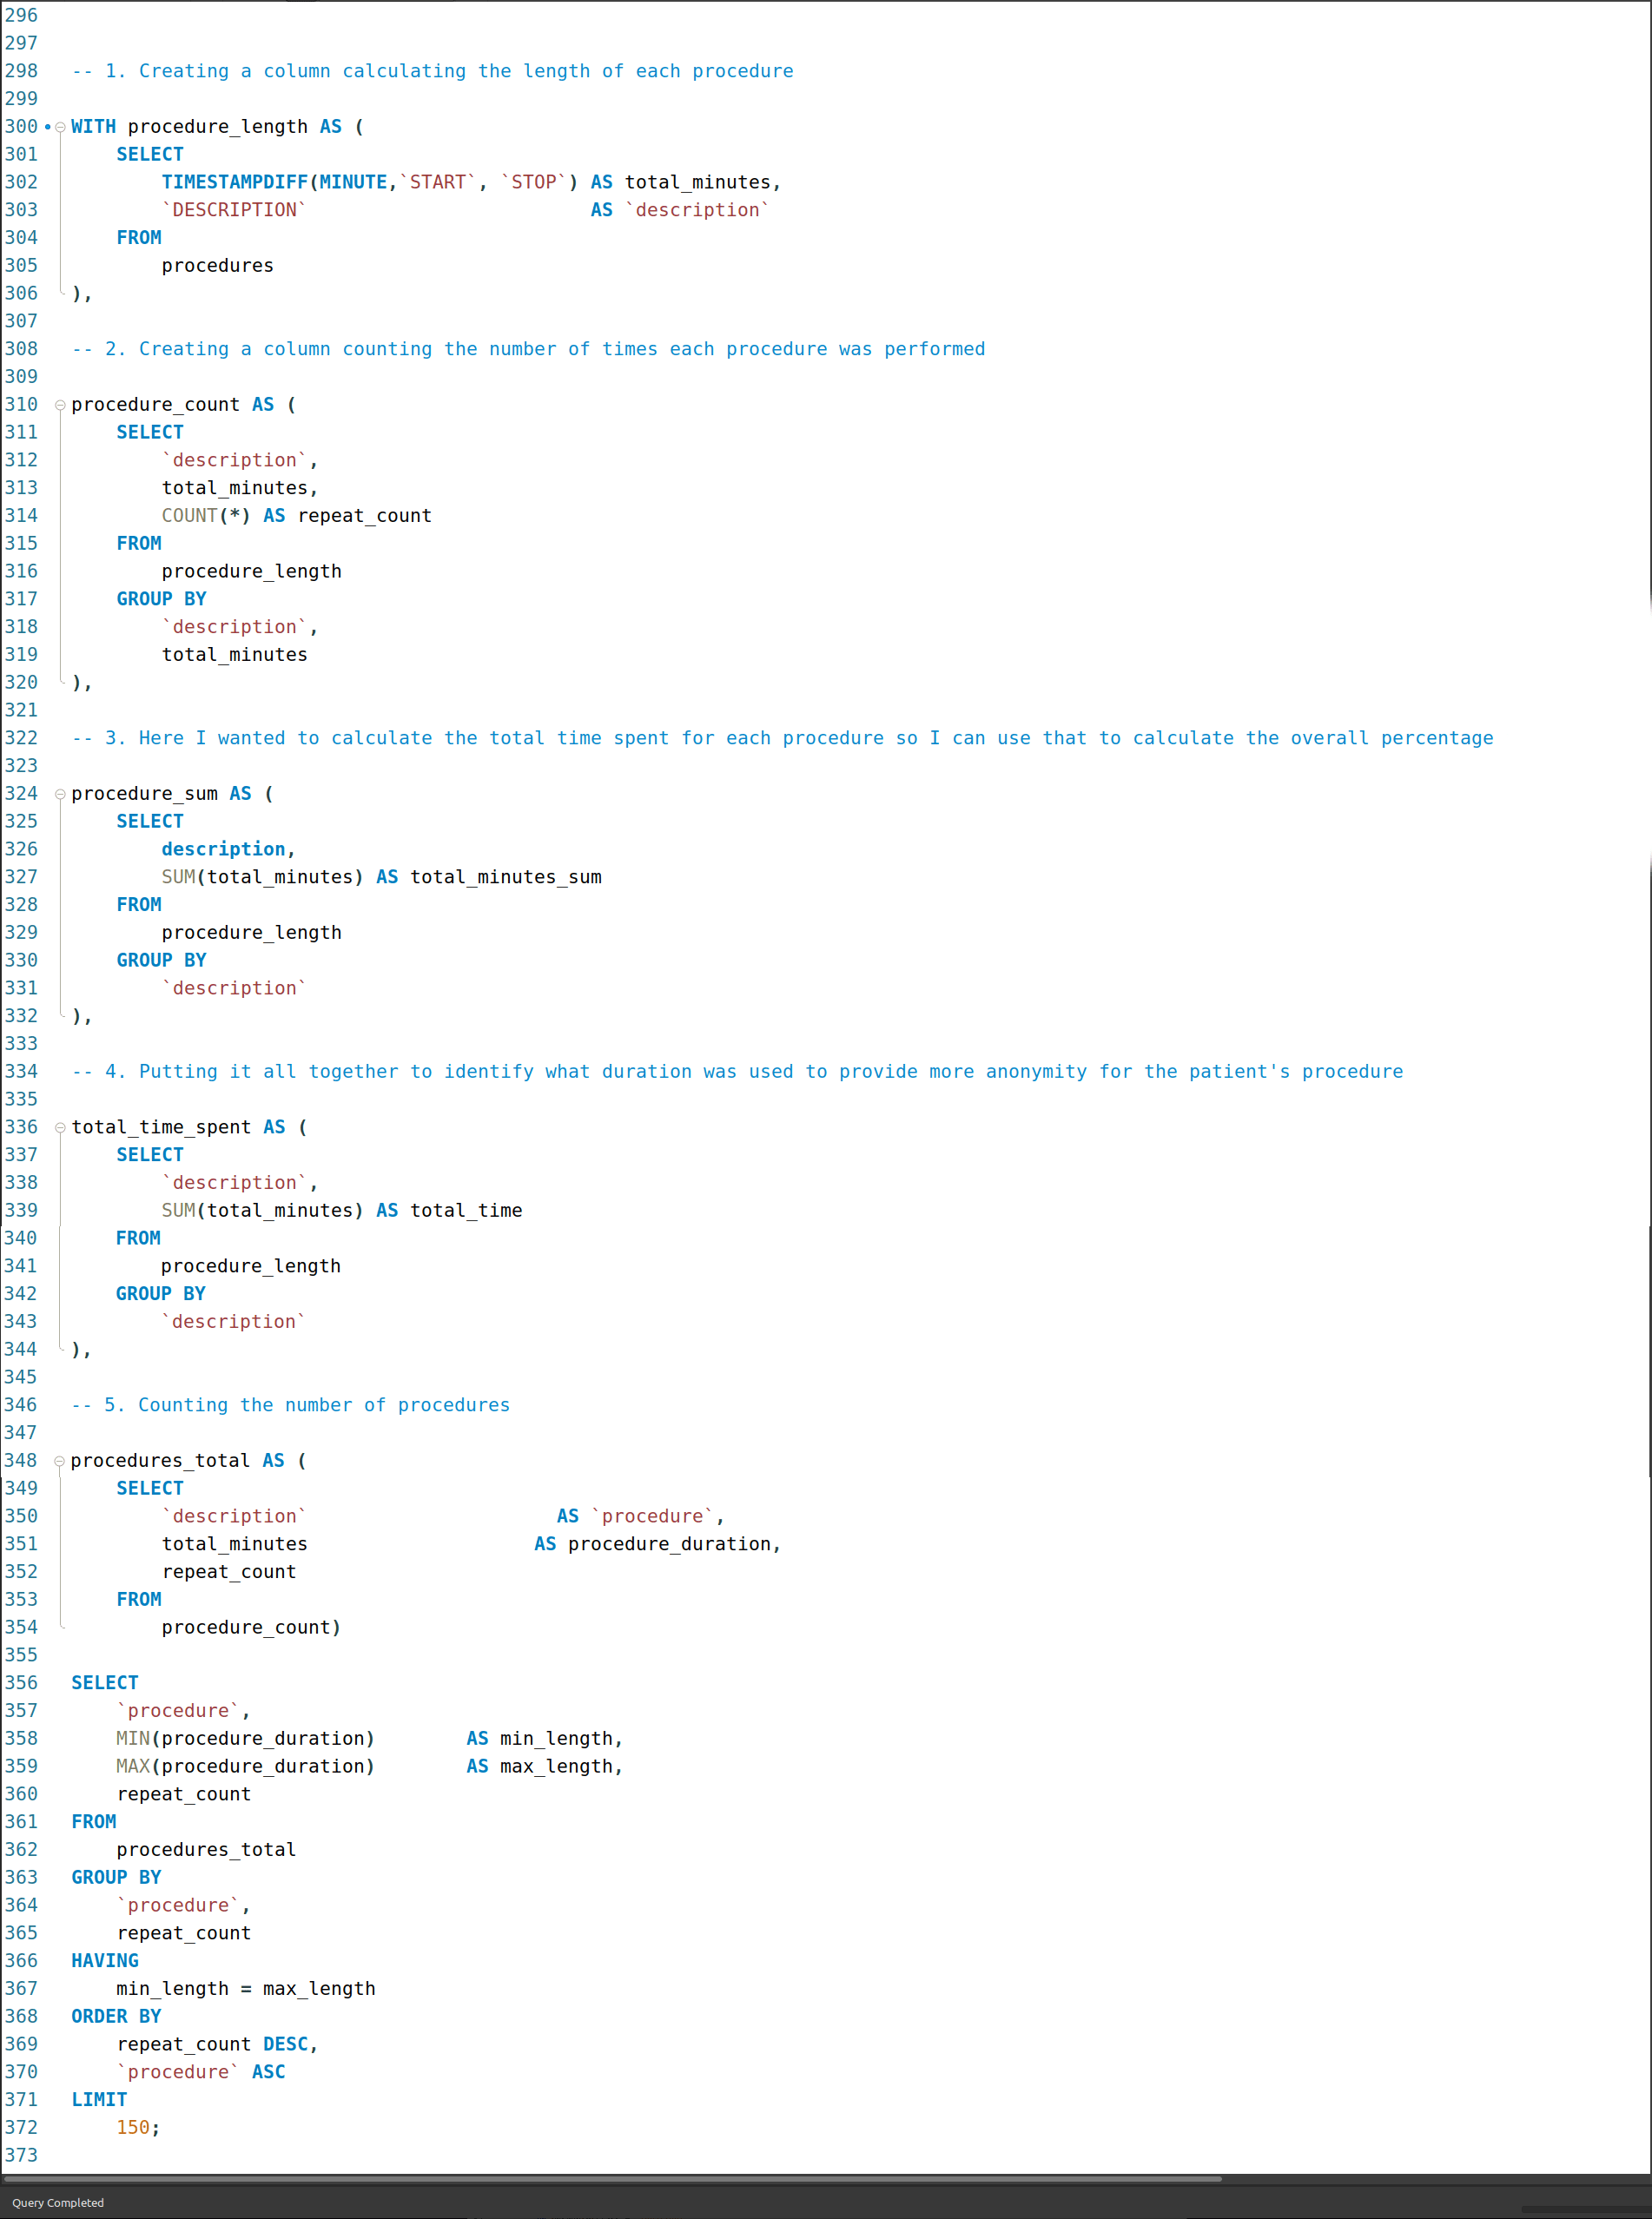
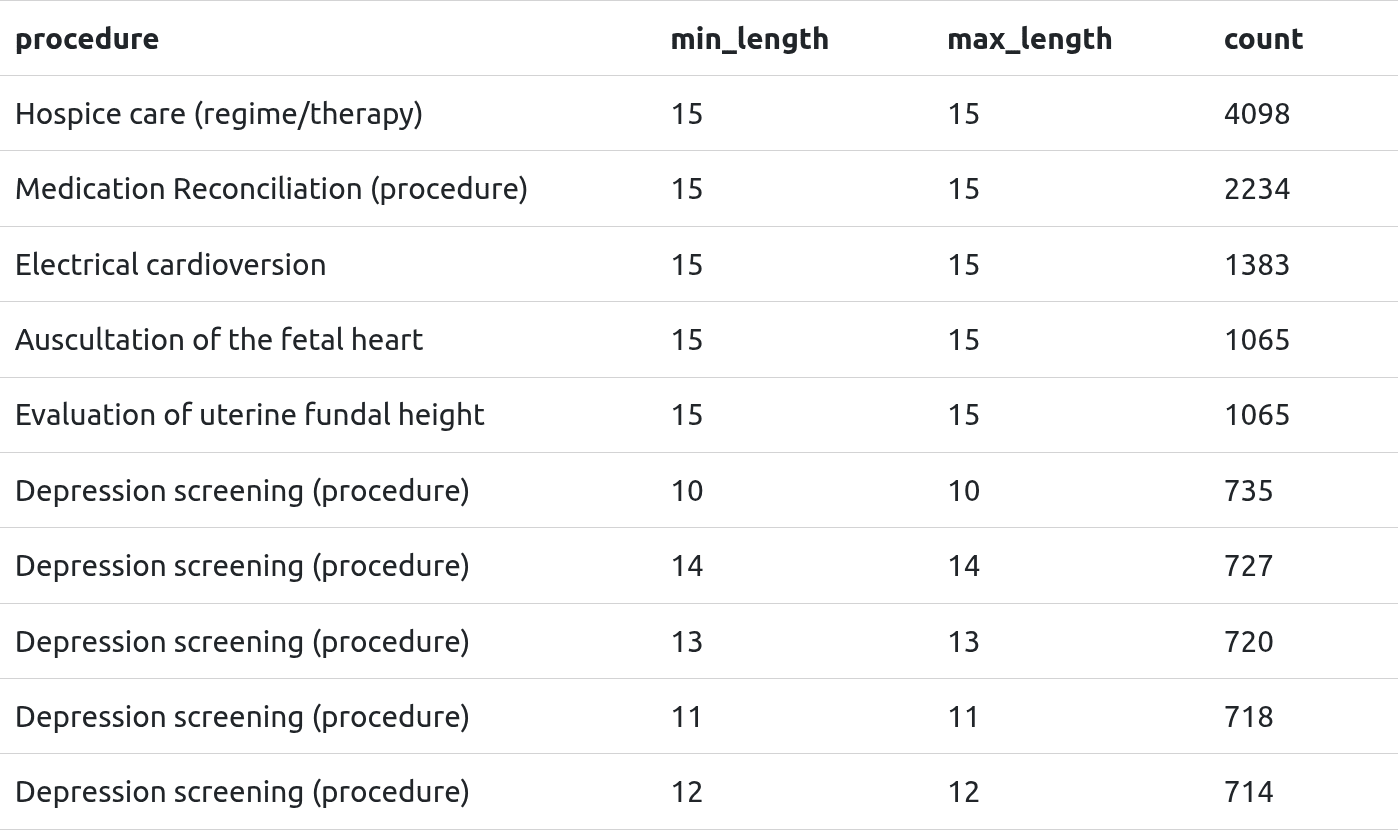
I also noticed, particularly with depression-related procedures that there was a binning of duration. My theory with that is it might be a way to class the type of procedure without being specific about the type of case. So, a shorter duration might not have been as serious a case as one that had a longer duration.
Can’t say for sure, but I thought it was worth mentioning as an interesting method of coding within anonymisation.
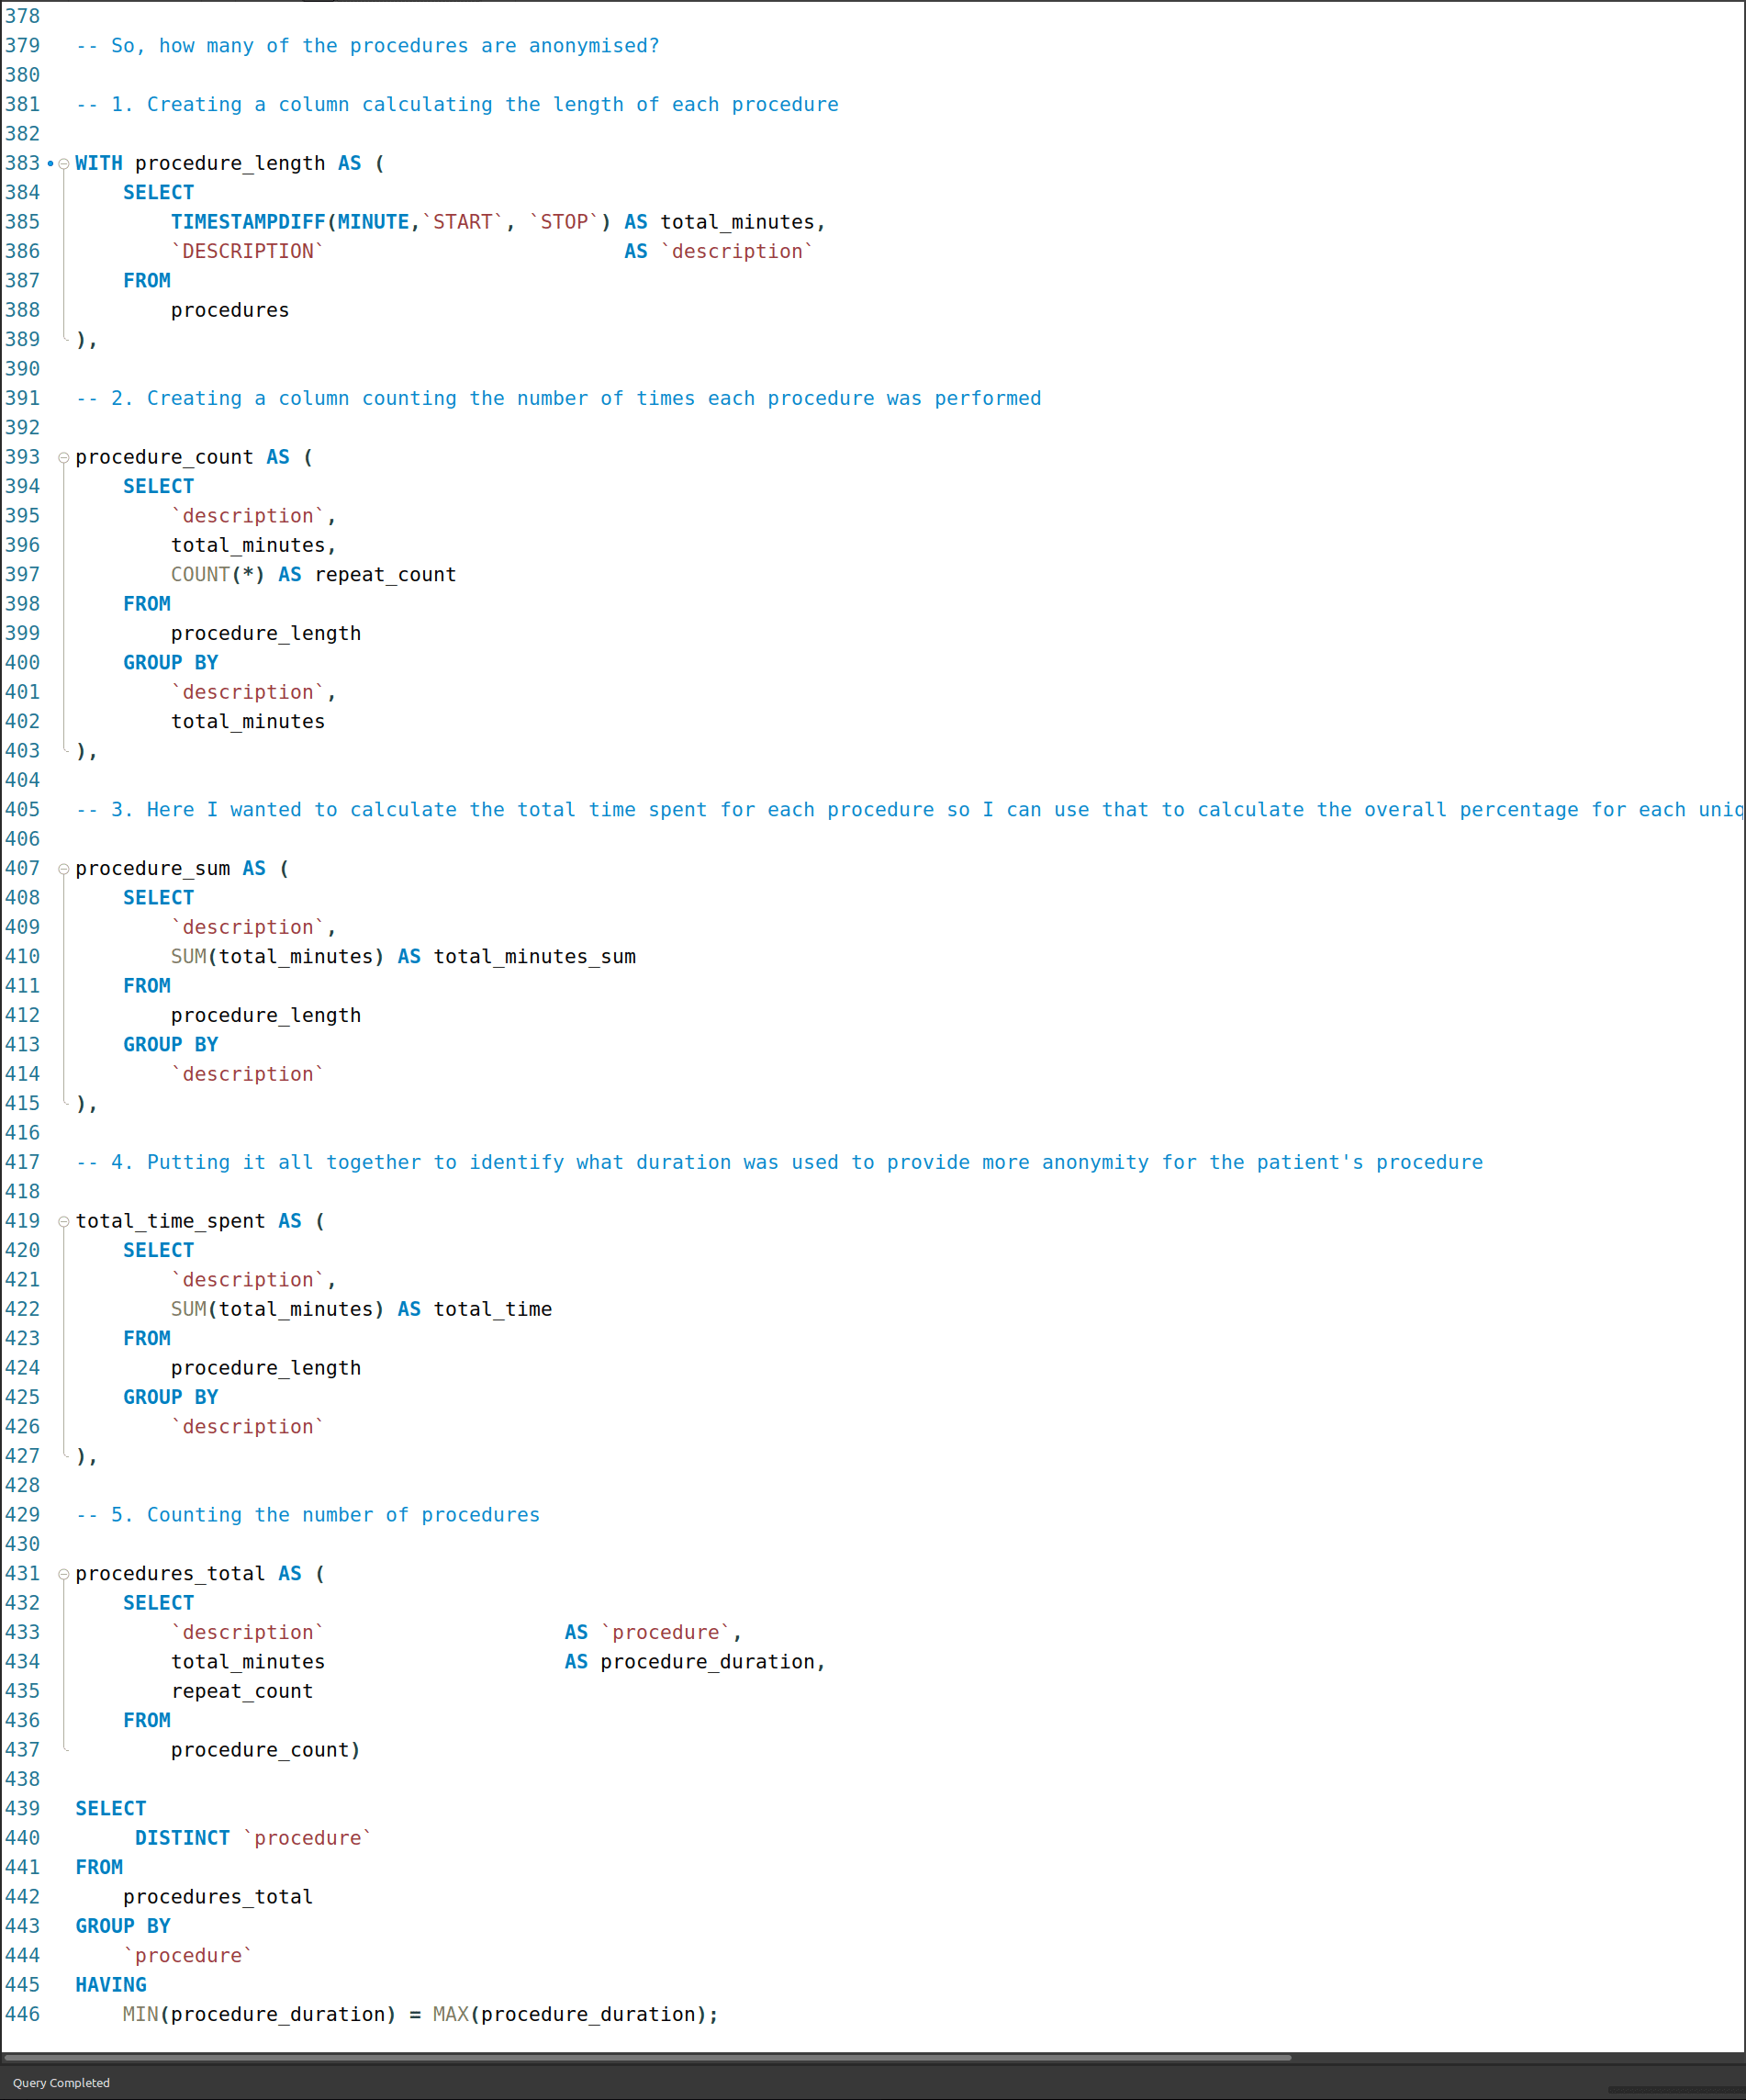
Anonymised procedures
I was curious about which procedures were possibly –
I have to say “possibly”, given that this is synthetic data and the similarity in time lengths is just a result of limited parameters
– anonymised, so I adapted the previous query to look them up:
Here’s a text cloud of the procedures I think* are anonymised. I removed the “(procedure)” suffix to keep it tidy.
Diagnostic fiberoptic bronchoscopy
Electrical cardioversion
Screening for chromosomal aneuploidy in prenatal amniotic fluid
Evaluation of uterine fundal height
Auscultation of the fetal heart
Depression screening
Physical examination
Hearing examination
High resolution computed tomography of chest without contrast
Hospice care (regime/therapy)
Alpha-fetoprotein test
Fetal anatomy study
Spirometry
Pulmonary rehabilitation (regime/therapy)
Placing subject in prone position
Oxygen administration by mask
Biopsy of prostate
Patient discharge
Upper arm X-ray
Ankle X-ray
Catheter ablation of tissue of heart
Vaccination for diphtheria pertussis and tetanus
Urine screening for glucose
Hemoglobin / Hematocrit / Platelet count
Rectal polypectomy
Peripheral blood smear interpretation
Streptococcus pneumoniae group B antigen test
Partial resection of colon
Screening for occult blood in feces
Episiotomy
Childbirth
Chest X-ray
Physical examination following birth
Throat culture
Clavicle X-ray
Urine screening test for diabetes
Chlamydia antigen test
Syphilis infection test
Standard pregnancy test
Rubella screening
Ultrasound scan for fetal viability
Urine protein test
Gonorrhea infection test
Urine culture
Hepatitis C antibody test
Measurement of Varicella-zoster virus antibody
Cytopathology procedure preparation of smear genital source
Hepatitis B Surface Antigen Measurement
Blood typing RH typing
Human immunodeficiency virus antigen test
Skin test for tuberculosis
Physical examination of mother
Epidural anesthesia
Cesarean section
Knee X-ray
Percutaneous mechanical thrombectomy of portal vein using fluoroscopic guidance
Induced termination of pregnancy
Counseling for termination of pregnancy
Pregnancy termination care
Physical exam following abortion
Monitoring of patient (regime/therapy)
Augmentation of labor
Information gathering
Medical induction of labor
RhD passive immunization
Spontaneous breech delivery
Referral to home health care service
X-ray or wrist
Pelvis X-ray
Instrumental delivery
Insertion of biventricular implantable cardioverter defibrillator
Sputum microscopy
Resuscitation using intravenous fluid
Transfer to stepdown unit
Premature birth of newborn
Fine needle aspiration biopsy of lung
Biopsy of colon
Extraction of wisdom tooth
Ultrasonography of abdomen right upper quadrant and epigastrium
Thoracentesis
Percutaneous coronary intervention
Coronary artery bypass grafting
Antenatal RhD antibody screening
Allergy screening test
Nasal sinus endoscopy
Admission to burn unit
Admission to long stay hospital
Mental health screening
Suicide risk assessment
Admit to ICU
Controlled ventilation procedure and therapy initiation and management
Methotrexate injection into tubal pregnancy
Microbial culture

While answering the earlier questions and starting the visualisation process, a few things stood out that I decided to look more closely into.
Insight 01: High admissions in 2014 & 2020
I was already expecting for 2019/20 to have higher than “normal” admissions due to the coronavirus pandemic, but the chart below shows that 2014 also had a relatively high volume.
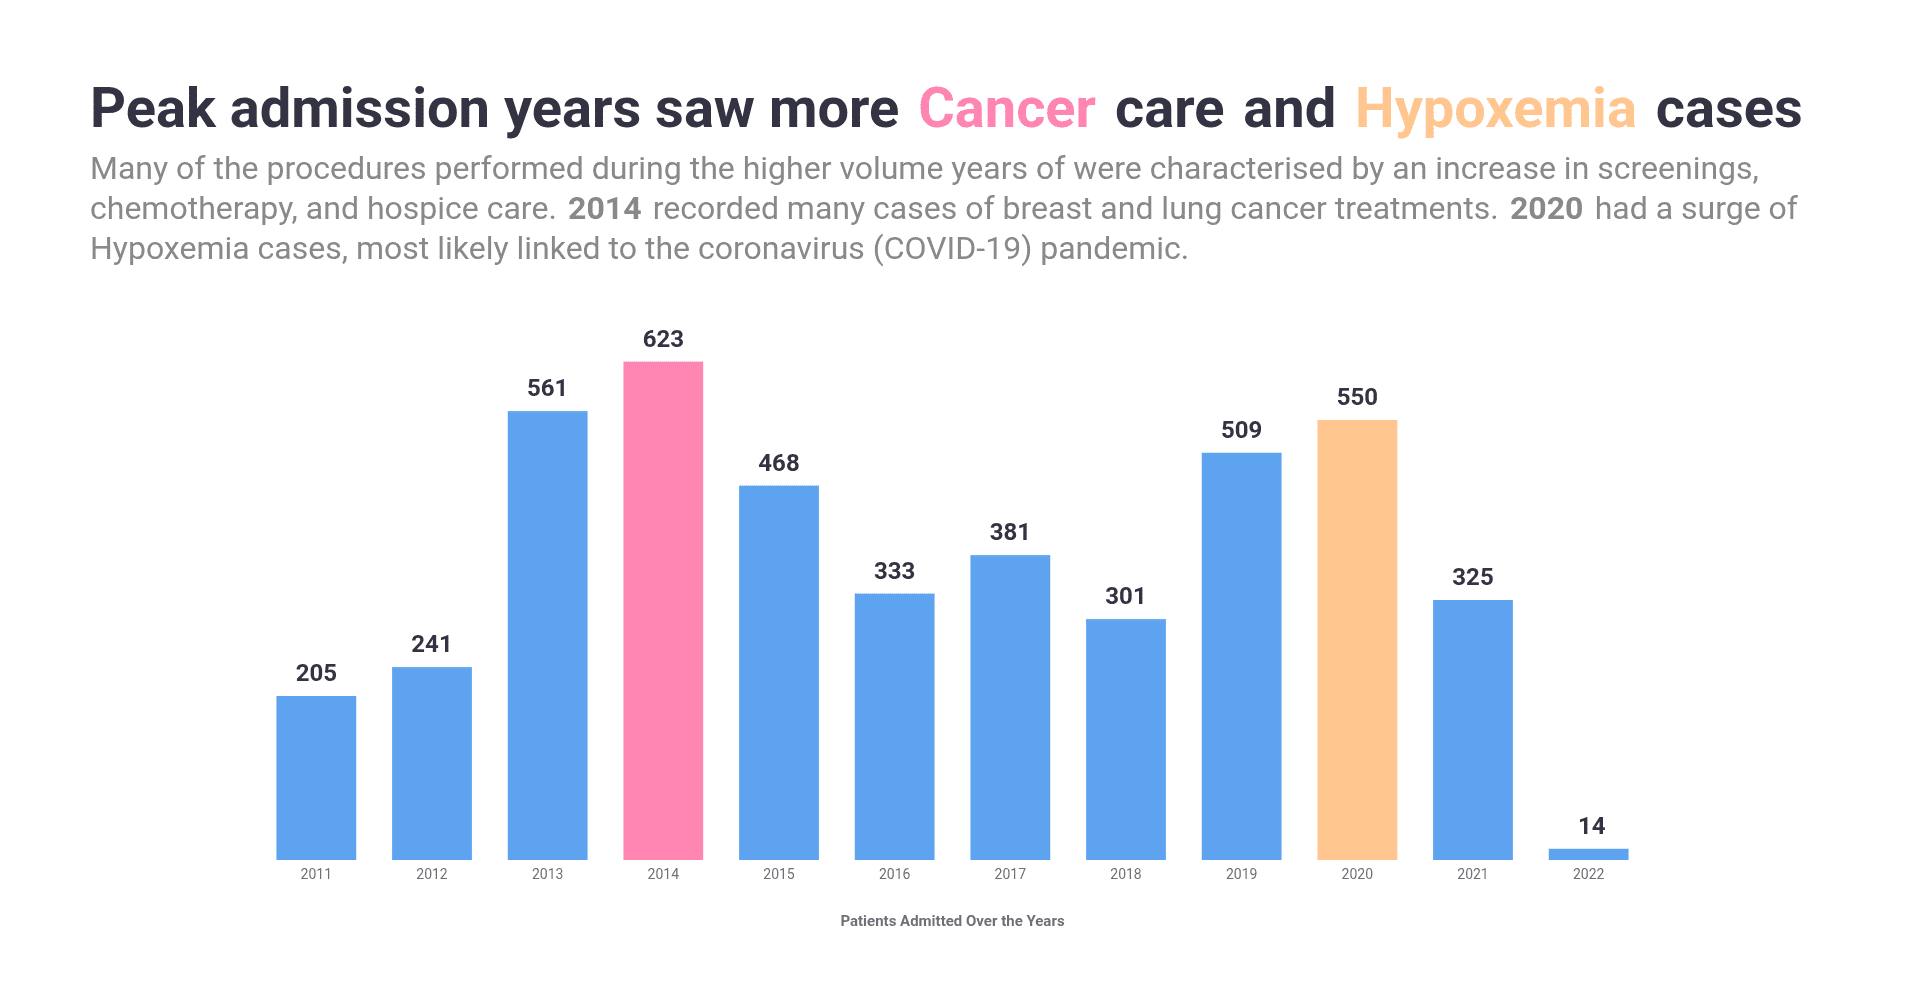
Getting this clarity involved having to segment the result set of the overall admissions into three separate tables that made it easier to get an idea for the cause for admission. This also a good opportunity to re-highlight that I took a heuristic approach to defining what constituted being admitted.
Insight 02: Regulatory corrections and COVID-19 greatly impacted costs and claims
Visualising the question about the average base cost alongside the average cost of a claim revealed an interesting inversion pattern.
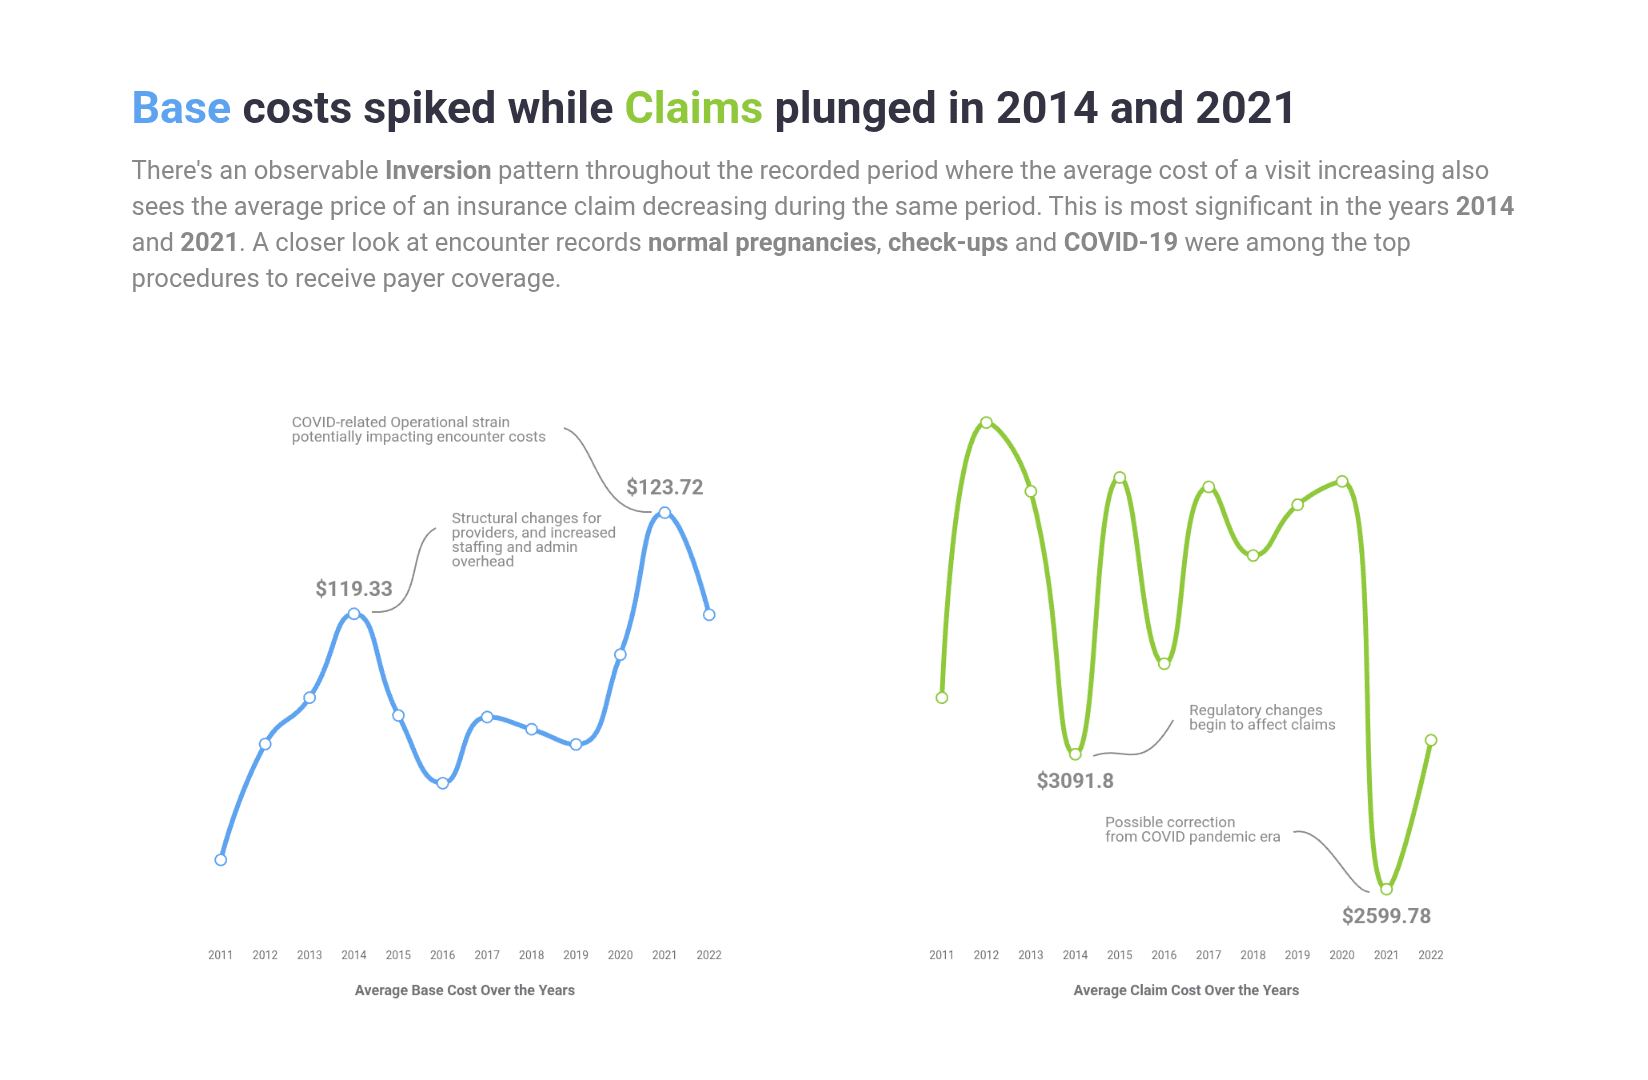
A closer look at the encounters table revealed that these periods had high columns of check-up, normal pregnancies for the 2014 peak, and an expected presence od COVID-related encounters in 2021.
Insight 03: People without insurance maintained a significant presence
Looking at the share of coverage provided by each insurer overall and then over the years consistently shows two distinct groups having the highest volumes - the uninsured, and Medicaid/Medicare/Dual Eligible.
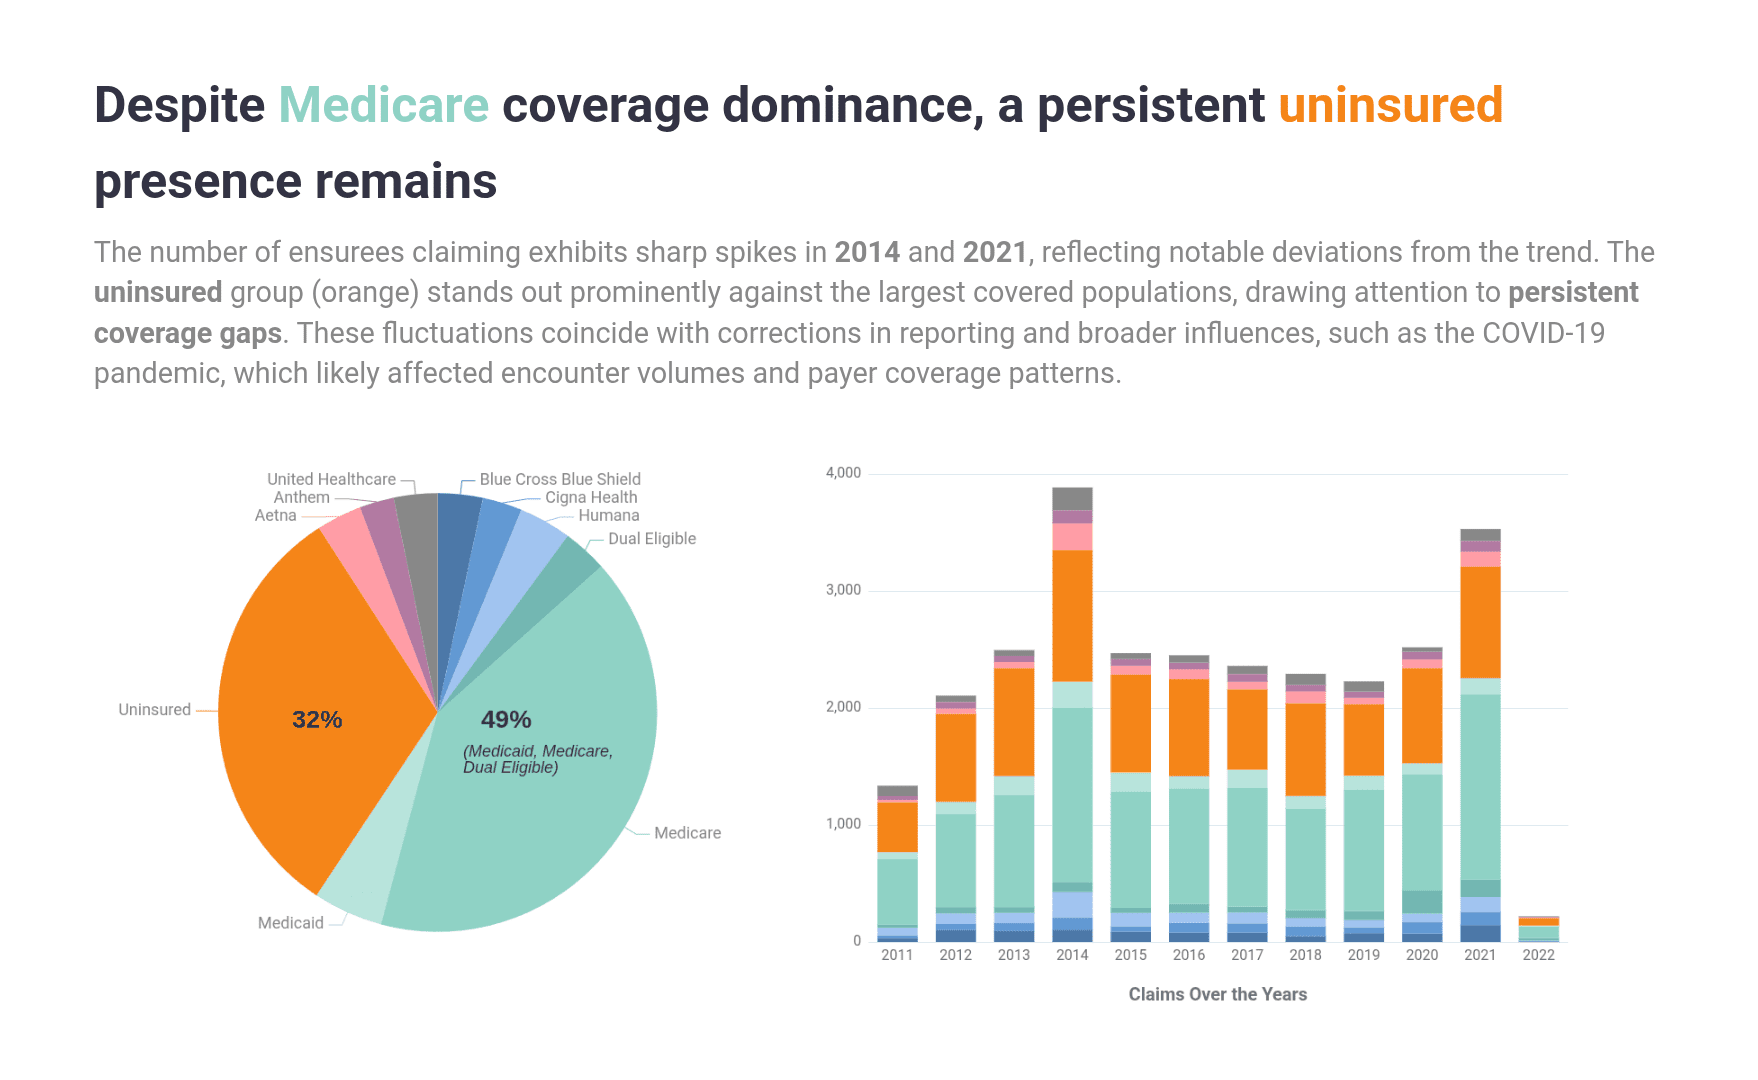
The findings above echo the findings from Insight 02, highlighting the impact of industry corrections and the COVID-19 pandemic.

This has been a great exercise in getting a lot of practice with CTE. Some queries more than three (3) CTEs with JOINs included. I also had previously never encountered cases where I had a FROM statement that referenced two tables, so I’m looking forward to getting more practice there.
It was also interesting working with hospital data, getting to learn about people’s lives through their relationships with the hospital. Some of their patients have been through so much..
Tags
quarto
project report
portfolio project
mysql
cte
dataviz
data visualization
line chart
bar chart
pie chart
data exploration
data analysis
data science
dataset
eda
rstudio
rstats
rlang
javascript
html
css
machine learning
maven analytics
maven challenge
maven hospital challenge
massachusetts general hospital
healthcare
healthcare analytics
mgh
sql
cte
shiny
shiny app
echarts
echarts4r