Power BI Dashboards

This entry is related to South African energy exploration that on RStudio that you can look at here. My intentions for this segment of the exploration is to take the same data and generate some dashboards that you would find for up-to-date looks on some statistics - snapshots.
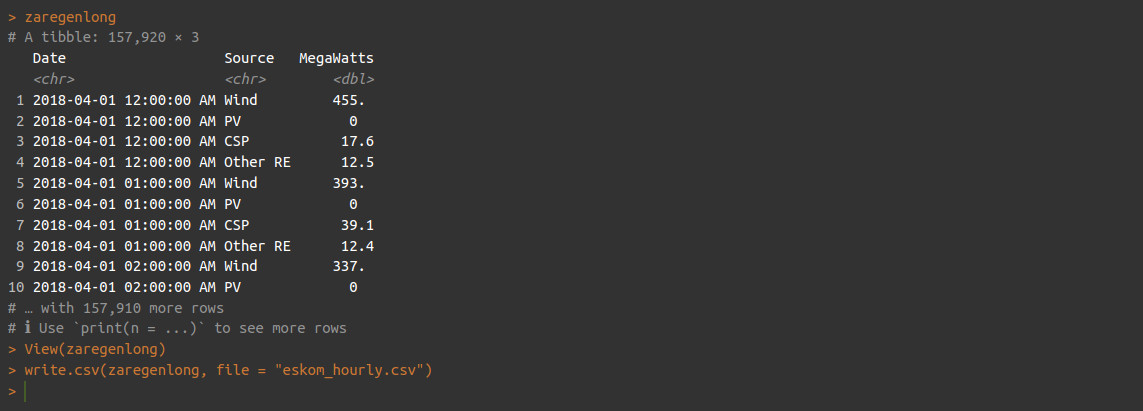
The dataset I wanted to look at was the one containing the hourly measurements of the different sources of renewable energy from ESKOM (“zaregenlong”) that was generated and exported from RStudio.
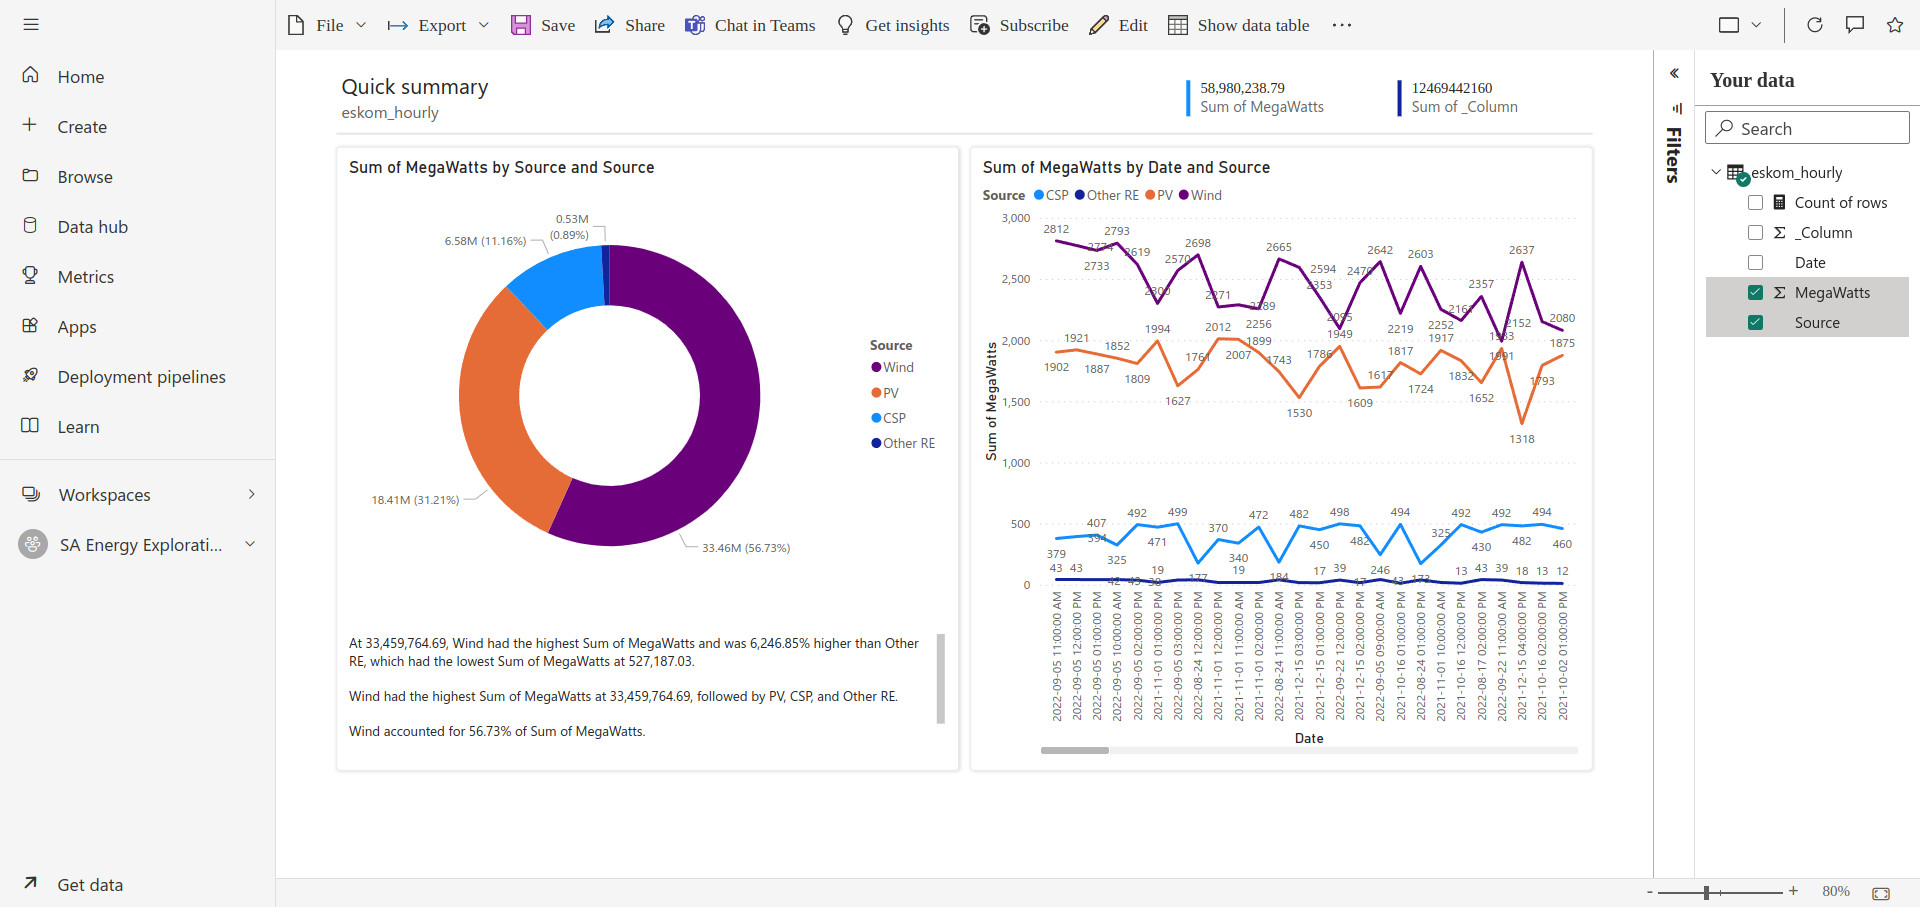
As with the plots generated in RStudio, my long-held assumptions that solar was “king” are squashed. Before continuing any further I had a look at the locations of South Africa’s wind farms which are concentrated in the Northern, Western, and Eastern Capes. What makes this more interesting for me is the potential to further maximize generation using recent technologies in wind energy harvesting such as this example.
Below are some WEBPs from a screen recording as the free license I used on the Power BI site didn’t allow the publishing of the report. Today (14 January 2023) is also the last day of the trial, so my next round on Power BI will be when I can get the Desktop version installed - Linux :))))
End of exercise.
comments powered by Disqus