Code
 #loading libraries
 suppressPackageStartupMessages({
   library(htmltools)
   library(htmlwidgets)
   library(webshot2) # for exporting the presentation panel as a high resolution image
   })


 # presentation base container (the canvas)
 basotho_wool_final_viz <-
   htmltools::tagList(
   tags$div(
     style = "
       background-color: white;
       padding: 50px;
       margin-left: 20px;
       margin-right: 50px;
       margin-bottom: 20px;
       ",

   # responsive flexbox for the headline
  tags$div(
    style = "
     display: flex;
     flex-wrap: wrap;
     gap: 30px;
     align-items: flex-start;
     width: 100%;
   ",

     # headline and subtitle wrapper
     tags$div(
       style = "
         flex: 1;
         min-width: 400px;
         display: flex;
         flex-direction: column;
         padding-bottom: 20px;
       ",
       # title
       tags$div(
         style = "text-align:left; margin-bottom: 15px; font-family: Plus Jakarta Sans; font-weight: 950; line-height: 1.1;",
         HTML(
           "<span style='color:#00205b; font-size:55px;'>Decoupling</span> <span style='color:#888; font-size:55px;'>, </span> <span style='color:#00743c; font-size:55px;'>Regional Realignment </span> <span style='color:#888; font-size:55px;'>, </span> <span style='color:#8c2d19; font-size:55px;'> Secondary Buyer Re-entry </span> <span style='color:#888; font-size:55px;'>, and </span> <span style='color:#262626; font-size:55px;'> Emerging Markets </span> "
       )
     ),
       # subtitle
       tags$div(
         style = "text-align:left; font-family: Inter, sans-serif; font-size:26px; font-weight: 300; # color:#888; line-height:1.4; margin-bottom:30px;",
         HTML(
           "Between <span style='font-weight: 700;'> 2011 </span> and <span style='font-weight: 700;'> 2013 </span>, Lesotho’s international wool exports featured a distinct multi-market footprint, driven heavily by Indian manufacturing demand alongside established South African trade routes. The landmark <span style='font-weight: 700;'> 2018 Agricultural Marketing (Wool and Mohair Licensing) Regulations </span> fundamentally disrupted this landscape, severing traditional South African brokerage pipelines in favor of direct Chinese licensing channels. Amplified by COVID-19 market shocks, trade consolidated heavily into a dual-partner framework. However, the 2023–2024 ledger signals a potential broadening of the international buyer base, marked by India’s return to the $500,000 threshold and Uruguay’s debut into the volume trade bracket."
         )
       )

     )
  ),

# responsive flexbox that holds the chart
tags$div(
  style = "
    display: flex;
    flex-wrap: wrap;
    gap: 20px;
    align-items: flex-start;
    width: 100%;
  ",

    # the chart
    tags$img(src = "img/TT1/tt1003.png", style = "width: 100%; height: auto;")

), # closing responsive flexbox that holds the chart


 # start of page footer with data and author details
 tags$div(
   style = "display: flex; justify-content: center; align-items: center; flex-wrap: wrap; margin-top: 25px; margin-bottom: 10px;",

   # Data Source wrapper to ensure it scales nicely
   tags$span(
     style = "display: inline-flex; align-items: center;",

     tags$span(
       "Data Source :",
       style = "color: #888; text-decoration: none; font-family: Plus Jakarta Sans; font-size: 18px; font-weight: 450; margin-right: 5px;"
     ),

     # tidy tuesday repo link
     tags$a(
       "Basotho Wool via Tidy Tuesday (2026-31)",
       href = "[https://github.com/rfordatascience/tidytuesday/blob/main/data/2026/2026-08-04/readme.md](https://github.com/rfordatascience/tidytuesday/blob/main/data/2026/2026-08-04/readme.md)",
       target = "_blank",
       style = "color: #00205b; text-decoration: none; font-family: Plus Jakarta Sans; font-size: 18px; font-weight: bold;"
     )
   ),

   # Replaced raw HTML spaces with a clean CSS margin spacer
   tags$span(style = "margin-left: 40px;"),

   # author social media handles wrapper
   tags$span(
     style = "display: inline-flex; align-items: center; gap: 20px;",

     # linkedin wrapper
     tags$span(
       style = "display: inline-flex; align-items: center; white-space: nowrap;",

       # linkedin logo
       tags$img(
         HTML('<svg xmlns="[http://www.w3.org/2000/svg](http://www.w3.org/2000/svg)" width="20" height="20" fill="#00205b"  class="bi bi-linkedin" viewBox="0 0 16 16">
       <path d="M0 1.146C0 .513.526 0 1.175 0h13.65C15.474 0 16 .513 16 1.146v13.708c0 .633-.526  1.146-1.175 1.146H1.175C.526 16 0 15.487 0 14.854zm4.943 12.248V6.169H2.542v7.225zm-1.2-8.212c.837 0  1.358-.554 1.358-1.248-.015-.709-.52-1.248-1.342-1.248S2.4 3.226 2.4 3.934c0 .694.521 1.248 1.327  1.248zm4.908 8.212V9.359c0-.216.016-.432.08-.586.173-.431.568-.878 1.232-.878.869 0 1.216.662 1.216  1.634v3.865h2.401V9.25c0-2.22-1.184-3.252-2.764-3.252-1.274 0-1.845.7-2.165  1.193v.025h-.016l.016-.025V6.169h-2.4c.03.678 0 7.225 0 7.225z"/>
     </svg>')
       ),

       # linkedin link
       tags$a(
         "Ntobeko Sosibo",
         href = "[https://www.linkedin.com/in/ntobeko-sosibo/](https://www.linkedin.com/in/ntobeko-sosibo/)",
         target = "_blank",
         style = "margin-left: 10px; color: #888; text-decoration: none; font-family: 'Plus Jakarta Sans'; font-size: 18px; font-weight: 450;"
       )
     ),

     # github wrapper
     tags$span(
       style = "display: inline-flex; align-items: center; white-space: nowrap;",

       # github logo
       tags$img(
         HTML(
           '<svg xmlns="[http://www.w3.org/2000/svg](http://www.w3.org/2000/svg)" width="20" height="20" fill="#00205b" class="bi bi-github" viewBox="0 0 16 16">
       <path d="M8 0C3.58 0 0 3.58 0 8c0 3.54 2.29 6.53 5.47 7.59.4.07.55-.17.55-.38  0-.19-.01-.82-.01-1.49-2.01.37-2.53-.49-2.69-.94-.09-.23-.48-.94-.82-1.13-.28-.15-.68-.52-.01-.53.63 -.01 1.08.58 1.23.82.72 1.21 1.87.87 2.33.66.07-.52.28-.87.51-1.07-1.78-.2-3.64-.89-3.64-3.95  0-.87.31-1.59.82-2.15-.08-.2-.36-1.02.08-2.12 0 0 .67-.21 2.2.82.64-.18 1.32-.27 2-.27s1.36.09 2  .27c1.53-1.04 2.2-.82 2.2-.82.44 1.1.16 1.92.08 2.12.51.56.82 1.27.82 2.15 0 3.07-1.87 3.75-3.65  3.95.29.25.54.73.54 1.48 0 1.07-.01 1.93-.01 2.2 0 .21.15.46.55.38A8.01 8.01 0 0 0 16 8c0-4.42-3.58-8-8-8"/>
     </svg>'
        )
       ),

       # github link
       tags$a(
         "afrikaniz3d-za",
         href = "[https://github.com/afrikaniz3d-za](https://github.com/afrikaniz3d-za)",
         target = "_blank",
         style = "margin-left: 10px; color: #888; text-decoration: none; font-family: Plus Jakarta Sans; font-size: 18px; font-weight: 450;"
         )
       ),

     # bluesky wrapper
     tags$span(
       style = "display: inline-flex; align-items: center; white-space: nowrap;",

       # bluesky logo
       tags$img(
         HTML(
           '<svg xmlns="[http://www.w3.org/2000/svg](http://www.w3.org/2000/svg)" width="20" height="20" fill="#00205b" class="bi bi-bluesky" viewBox="0 0 16 16">
       <path d="M3.468 1.948C5.303 3.325 7.276 6.118 8 7.616c.725-1.498 2.698-4.29 4.532-5.668C13.855.955 16 .186 16 2.632c0 .489-.28 4.105-.444 4.692-.572 2.04-2.653 2.561-4.504 2.246 3.236.551 4.06 2.375 2.281 4.2-3.376 3.464-4.852-.87-5.23-1.98-.07-.204-.103-.3-.103-.218 0-.081-.033.014-.102.218-.379 1.11-1.855 5.444-5.231 1.98-1.778-1.825-.955-3.65 2.28-4.2-1.85.315-3.932-.205-4.503-2.246C.28 6.737 0 3.12 0 2.632 0 .186 2.145.955 3.468 1.948"/>
     </svg>'
         )
       ),

       # bluesky link
       tags$a(
         "afrikaniz3d",
         href = "[https://bsky.app/profile/afrikaniz3d.bsky.social](https://bsky.app/profile/afrikaniz3d.bsky.social)",
         target = "_blank",
         style = "margin-left: 10px; color: #888; text-decoration: none; font-family: Plus Jakarta Sans; font-size: 18px; font-weight: 450;"
               )
             ), # closing bluesky wrapper

     # mastodon wrapper
     tags$span(
       style = "display: inline-flex; align-items: center; white-space: nowrap;",

       # mastodon logo
       tags$img(
         HTML(
           '<svg xmlns="[http://www.w3.org/2000/svg](http://www.w3.org/2000/svg)" width="20" height="20" fill="#00205b" class="bi bi-mastodon" viewBox="0 0 16 16">
       <path d="M11.19 12.195c2.016-.24 3.77-1.475 3.99-2.603.348-1.778.32-4.339.32-4.339 0-3.47-2.286-4.488-2.286-4.488C12.062.238 10.083.017 8.027 0h-.05C5.92.017 3.942.238 2.79.765c0 0-2.285 1.017-2.285 4.488l-.002.662c-.004.64-.007 1.35.011 2.091.083 3.394.626 6.74 3.78 7.57 1.454.383 2.703.463 3.709.408 1.823-.1 2.847-.647 2.847-.647l-.06-1.317s-1.303.41-2.767.36c-1.45-.05-2.98-.156-3.215-1.928a4 4 0 0 1-.033-.496s1.424.346 3.228.428c1.103.05 2.137-.064 3.188-.189zm1.613-2.47H11.13v-4.08c0-.859-.364-1.295-1.091-1.295-.804 0-1.207.517-1.207 1.541v2.233H7.168V5.89c0-1.024-.403-1.541-1.207-1.541-.727 0-1.091.436-1.091 1.296v4.079H3.197V5.522q0-1.288.66-2.046c.456-.505 1.052-.764 1.793-.764.856 0 1.504.328 1.933.983L8 4.39l.417-.695c.429-.655 1.077-.983 1.934-.983.74 0 1.336.259 1.791.764q.662.757.661 2.046z"/>
     </svg>'
         )
       ),

       # mastodon link
       tags$a(
         "afrikaniz3d",
         href = "[https://mastodon.social/@afrikaniz3d](https://mastodon.social/@afrikaniz3d)",
         target = "_blank",
         style = "margin-left: 10px; color: #888; text-decoration: none; font-family: Plus Jakarta Sans; font-size: 18px; font-weight: 450;"
               )
             ) # closing mastodon wrapper
           ) # closing social media handles wrapper
         ) # closing page footer

   )
 )


 basotho_wool_final_viz
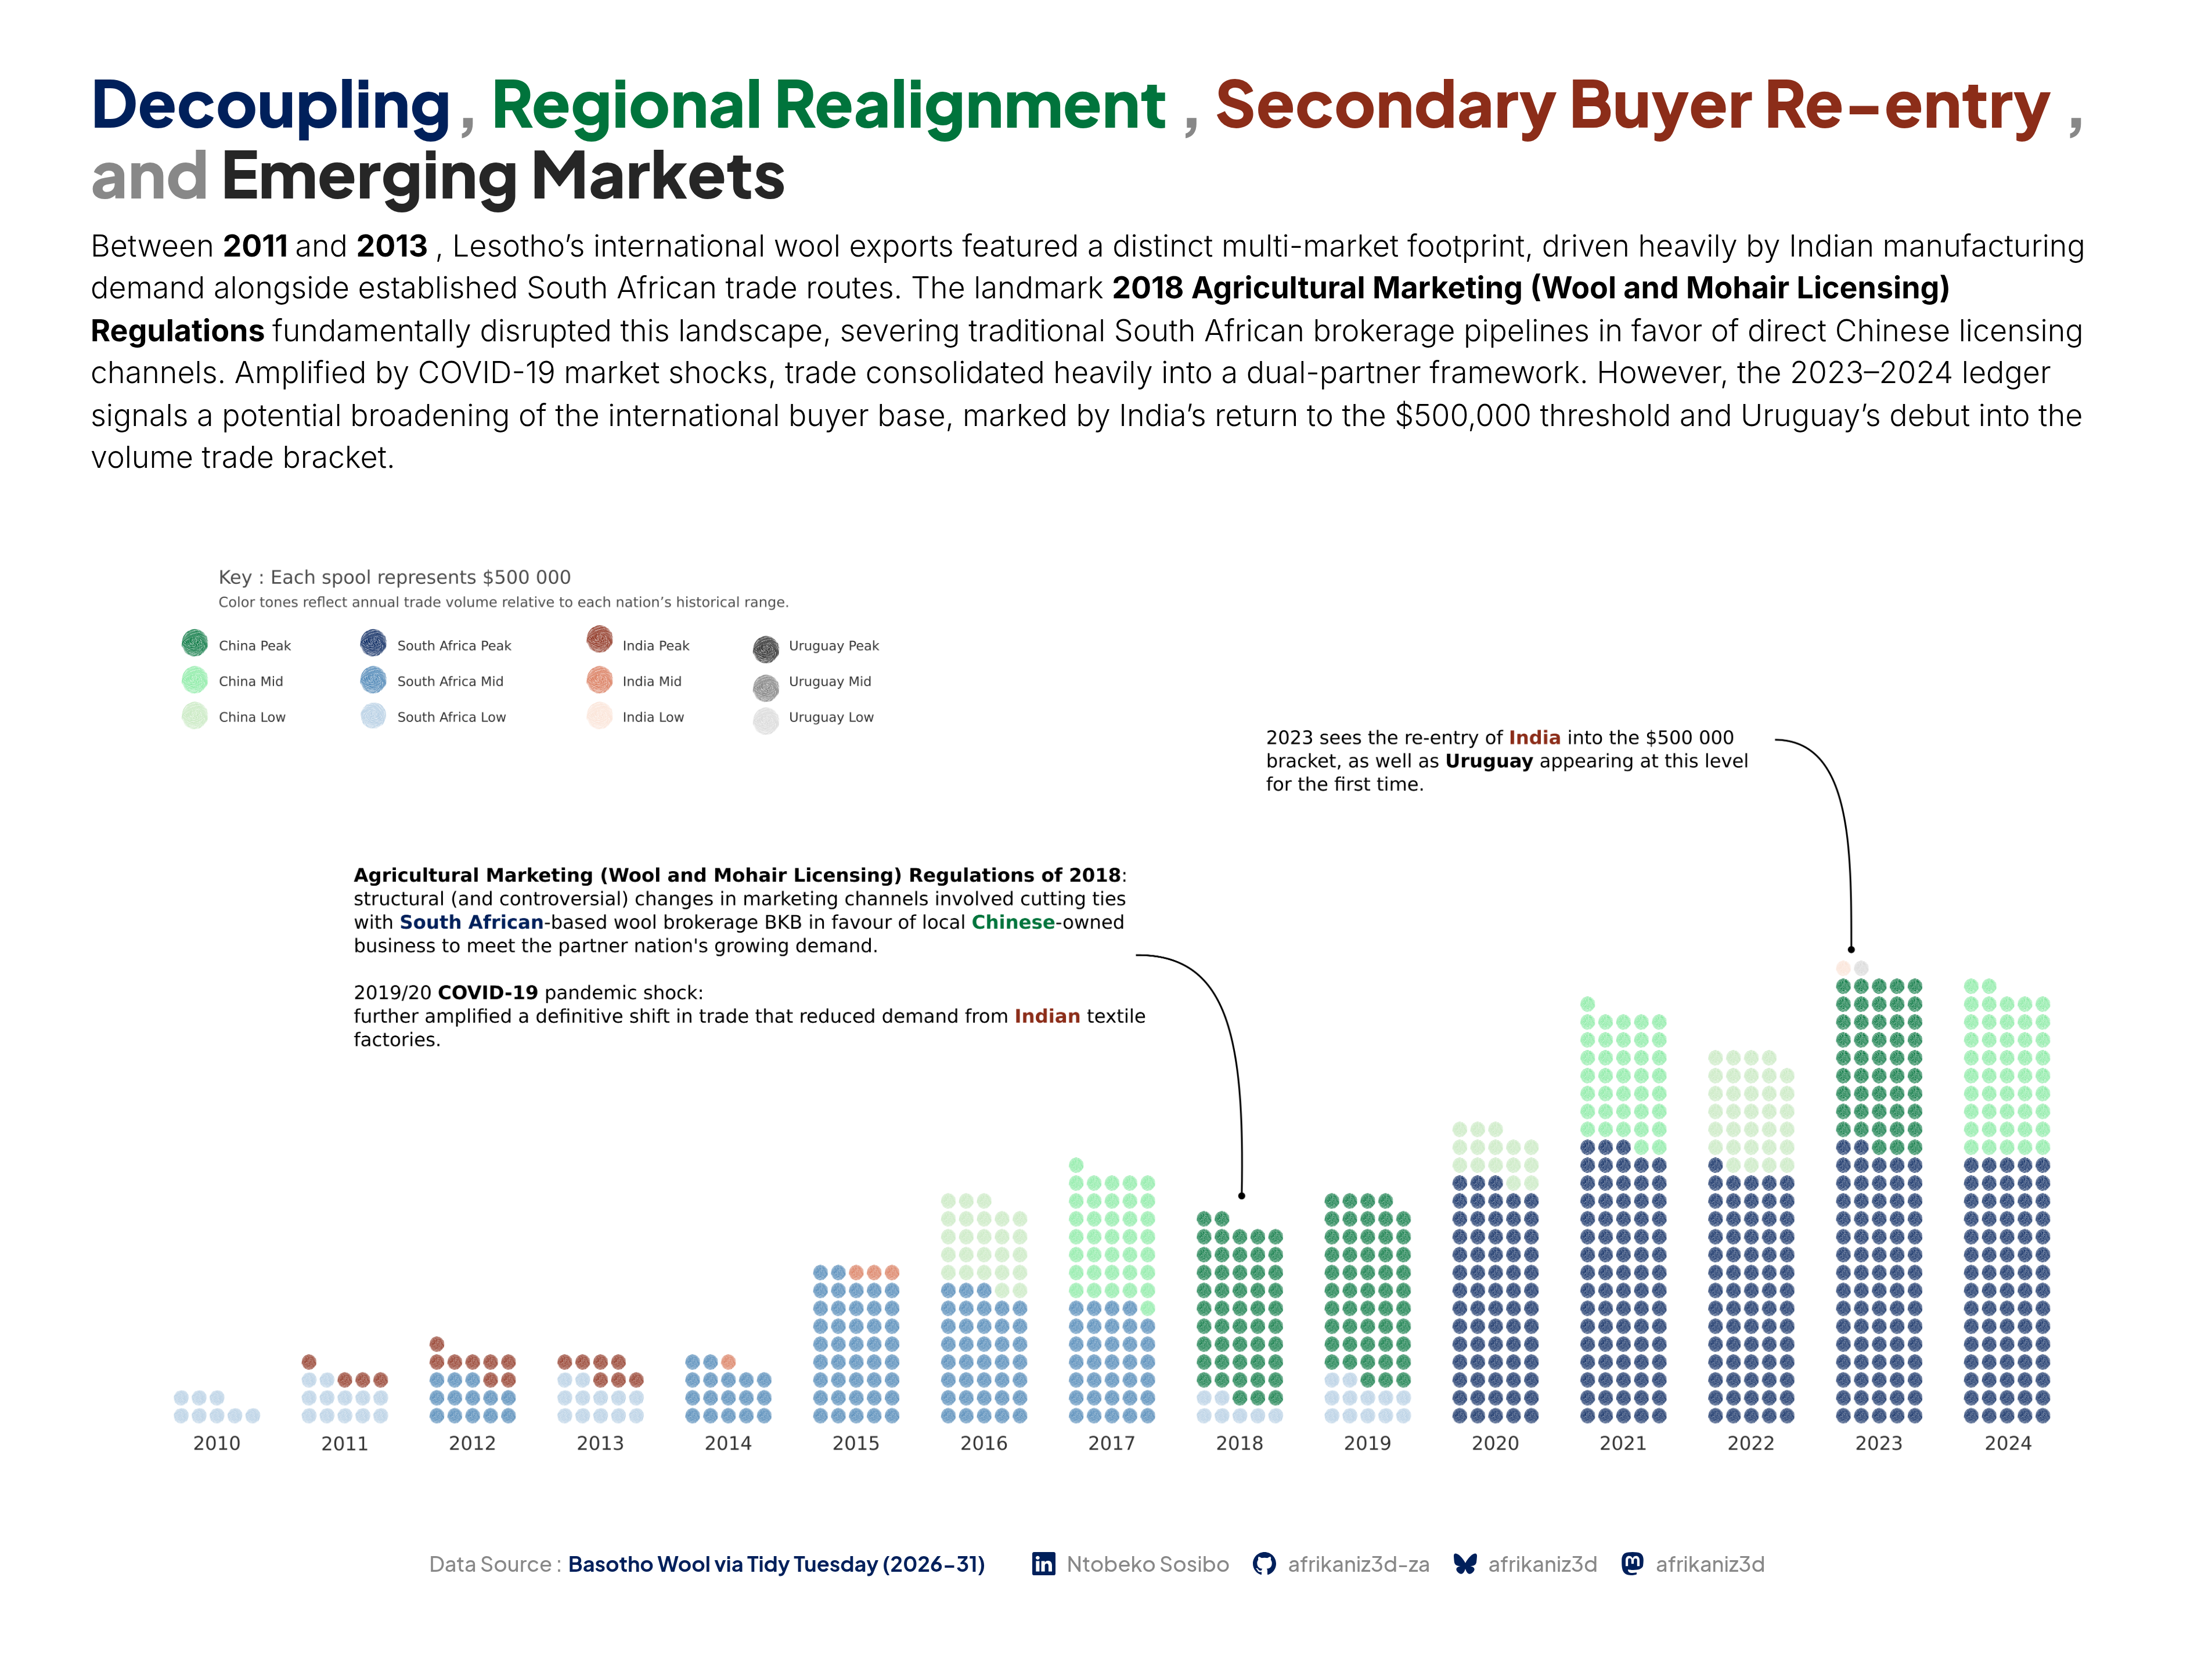
Decoupling , Regional Realignment , Secondary Buyer Re-entry , and Emerging Markets
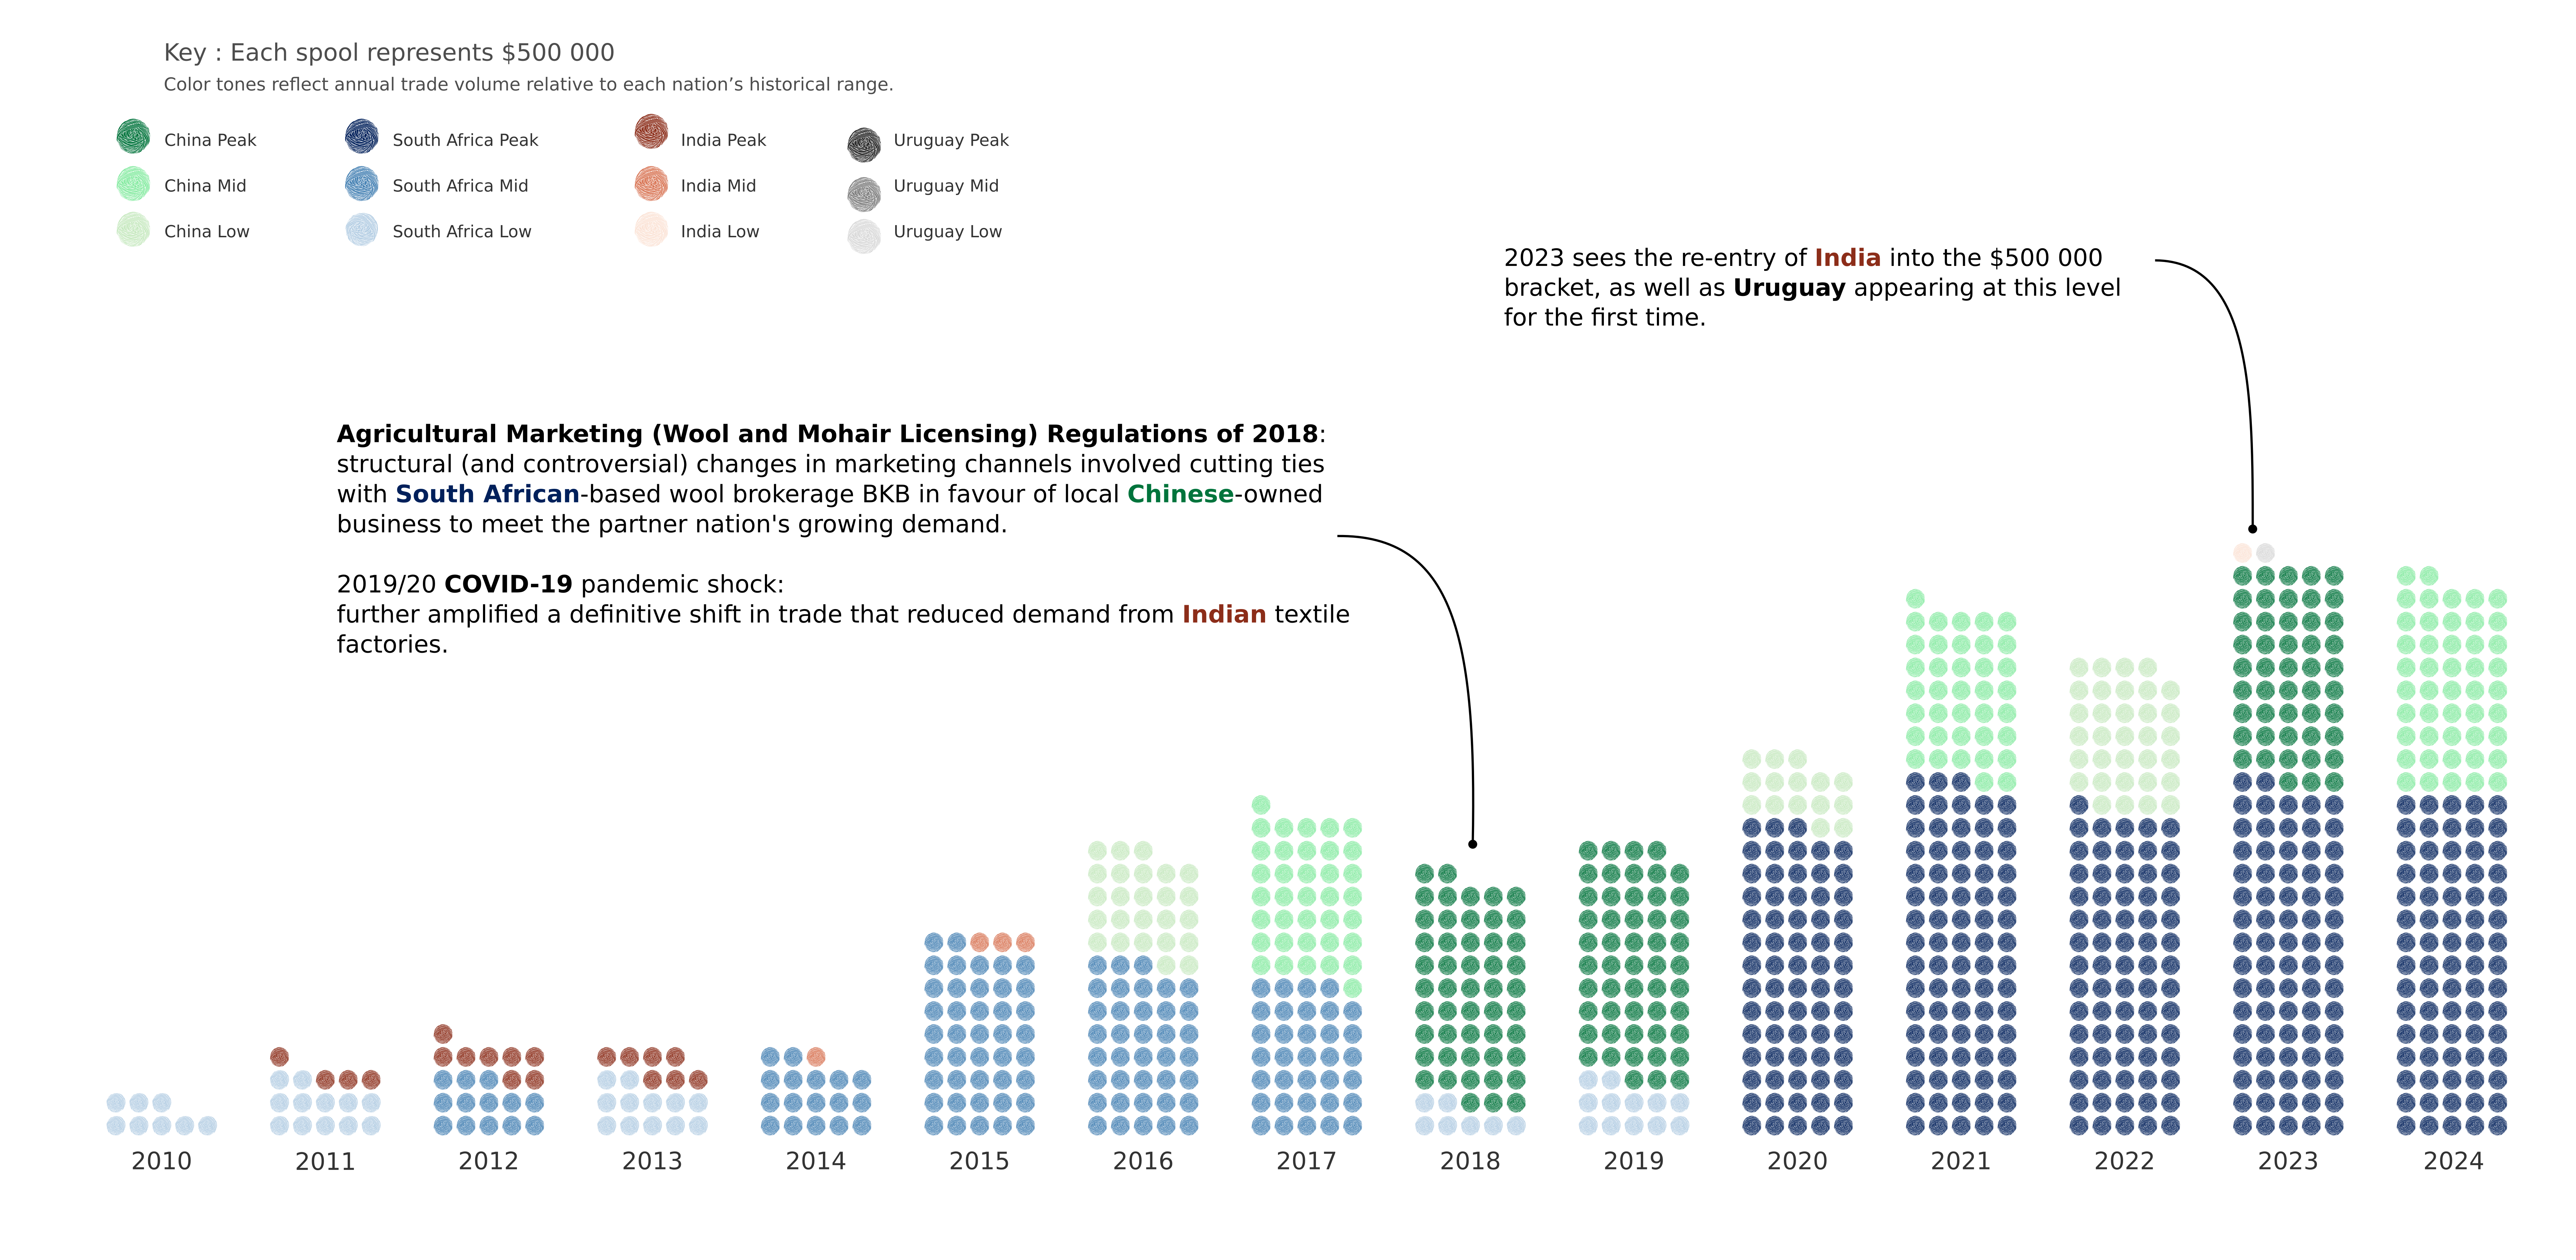
Between 2011 and 2013 , Lesotho’s international wool exports featured a distinct multi-market footprint, driven heavily by Indian manufacturing demand alongside established South African trade routes. The landmark 2018 Agricultural Marketing (Wool and Mohair Licensing) Regulations fundamentally disrupted this landscape, severing traditional South African brokerage pipelines in favor of direct Chinese licensing channels. Amplified by COVID-19 market shocks, trade consolidated heavily into a dual-partner framework. However, the 2023–2024 ledger signals a potential broadening of the international buyer base, marked by India’s return to the $500,000 threshold and Uruguay’s debut into the volume trade bracket.
Code
 #------------------------------------------------------
 # exporting the presentation as a high resolution image


 # writing the html file directly to the project folder
 htmltools::save_html(basotho_wool_final_viz, "temp_basotho_wool_final_render.html")


 # webshot "takes" a picture of the html file, saving it in the same directory
 webshot2::webshot(
   url = "temp_basotho_wool_final_render.html",
   file = "Basotho_Wool_Final.png",
   vwidth = 1920,
   vheight = 1080,
   delay = 3,       # extra time for any animations to complete playing
   zoom = 2         # double pixel density for sharpness
   )